dear team
I am struggling with two problems in my report, where I want to use a bar plit:
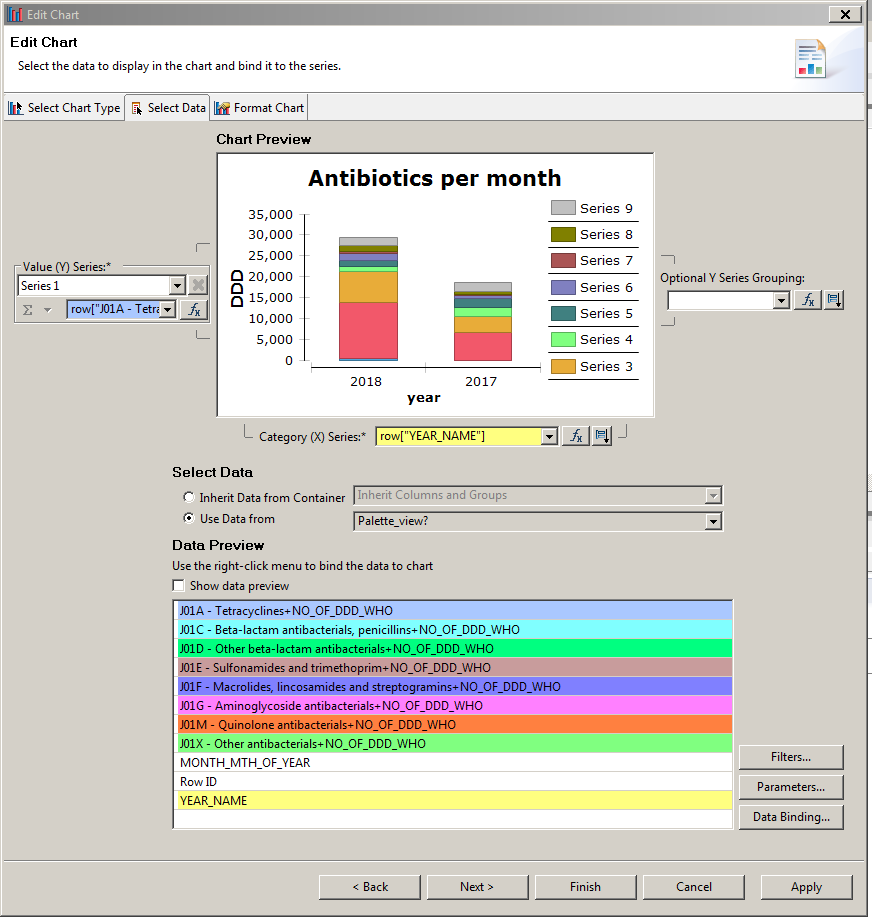
- how can I define subactegories on the x.axis (e.g. i would like to show the year first, divided in months)
- I managed to fill the value Y-series, but I cannot change the names (Series 1, Series 2…). By default I would like to column titles here (which then I could modify sligthly)
thanks in advance