I have a survey that asks: on a scale of 1 to 4, how likely are you to recommend a brand. The results are in a csv file where each column corresponds to each brand and rows for each respondent. It looks like this:
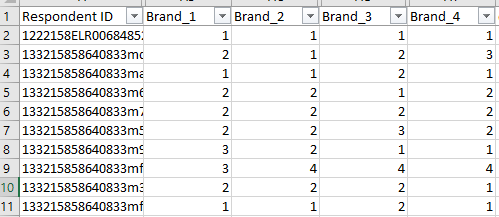
What I want is to summarize the result in a single table where the columns correspond to the scale, and the rows with the brands (see image below)

What I was trying to do is to use multiple pivot then join them, however it doesn’t appear to be the most efficient way of doing it since I have 20 question items and with at least 10 brands for each.
Do you have any recommended node/workflow to use for this? Thanks in advance!