Hello everybody,
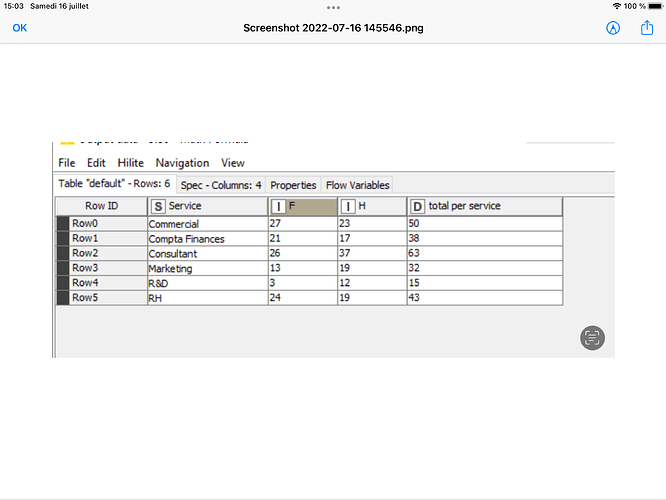
I have a table:
I want to make a sunburst chart : first circle will show total data per service,
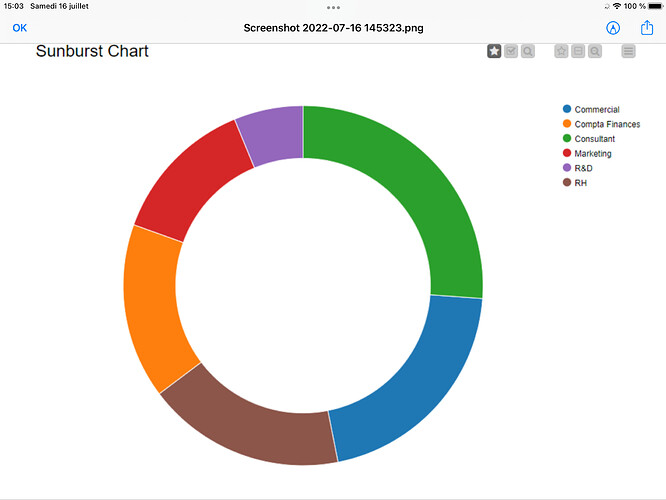
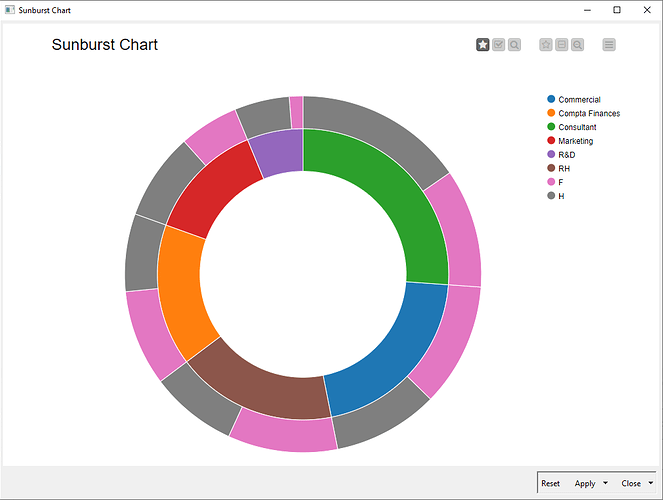
I tried to use sunburst node but it returns me only one attribute : only services. Here the result.
My idea is to show a doubled donner chart that shows both ( 2 cercles) services and gender data.
Any ideas how to realise this viz in KNIME?
Thank you and have a nice week end
Have you read the documentation for the Sunburst Chart Node ?
There are specific requirements for the data structure, and your table doesn’t seem to satisfy them.
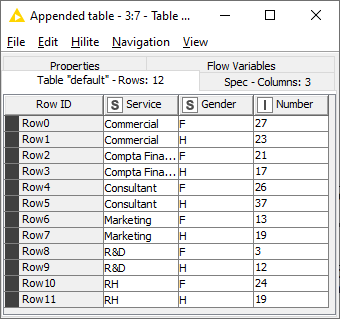
There needs to be a hierarchy:
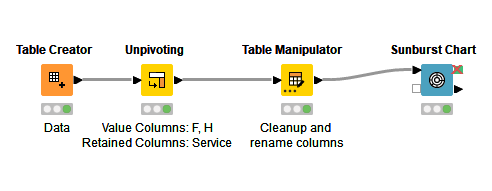
This can be created by unpivoting.
Then you’ll get something like this with the sunburst chart:
If you’d like the ring positions to be swapped, then you’d need to change the order of the columns before they get to the Sunburst Chart node.
2 Likes
@elsamuel I am so grateful for your help, you can’t imagine. I did it and I understood the procedure. Thank you very much. Wish you all the best!
2 Likes
I’m glad it helped. Can you mark this thread as solved?
system
July 24, 2022, 4:53am
6
This topic was automatically closed 7 days after the last reply. New replies are no longer allowed.
