At the post I mentioned there were no further discussion, so I have prepared the workflow and data that can reproduce the problem. I also managed to make a workaround, however this is solution is not perfect, since I got aggregated values, and the order of the grouping on the diagram was changed. Sunburst_example.knwf (39.8 KB)
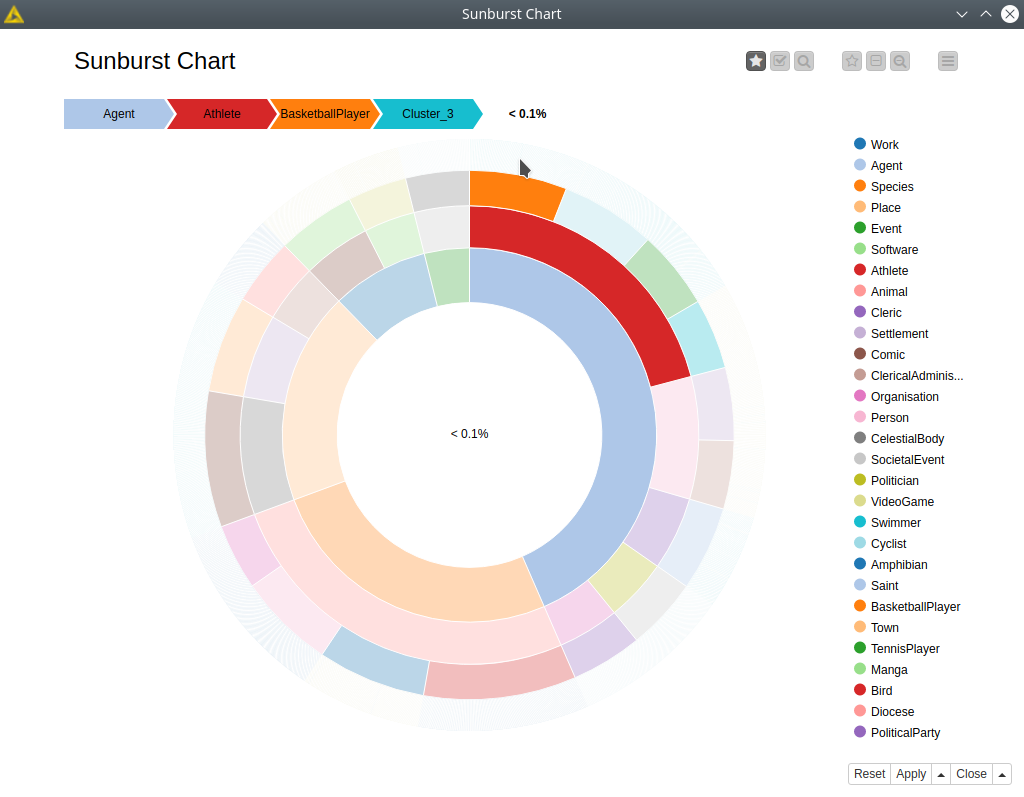
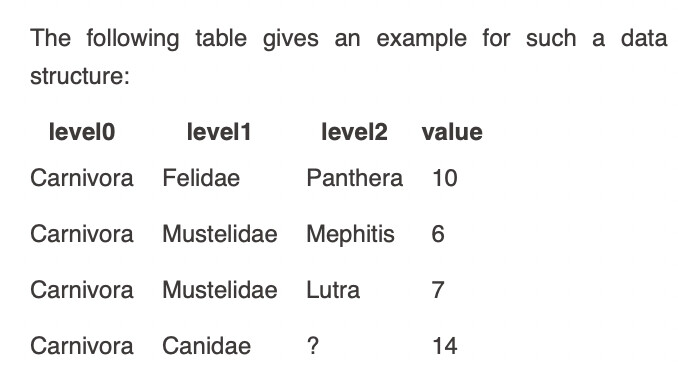
the problem here is, that the sunburst chart expects the input data to be in a specific format.
If you don’t include this last value column the chart takes each of the individual entries as a separate leaf node.
One solution to your problem might be to just group the input table by its leaf nodes and count the occurrences of those. I have attached a workflow which does this. Does this solve your problem or did I miss something?
This approach helped, so I consider this as the solution. However it looks very clunky to me, so I really hope this node can be improved in the future releases.