I do have two tables. The the exact same amount of rows and columns. Most of the values are the same. I removed in one of the tables all outlier using the numeric outliers node and replaced the outliers with missing values.
What i now wanna do is compare each and every cell of the two tables and kind of create a mask. If the cell values (could be integer, string, double, boolean) are the same i wanna have a false in my new resulting table. If they differ (value in original table, missing value in resulting table) i wanna have a true in the resulting table.
My final goal is to exactly indicate every outlier. E.g. I need to be able to say column 3 row 57 is an outlier.
And i need to be able to extract the value of this cell.
Knowing only the row or the column of each outlier is not enough. Better approaches are very welcome.
Thanks for your help
To create a mask table I would use a loop and in each iteration compare 2 columns. But from what you wrote this is not what you need cause why would you compare string/Boolean columns after using Numeric Outliers node? If I missed something and you would still like this approach I can make an example for you to check.
The question is what should your output look like? If you say “I need to be able to say column 3 row 57 is an outlier” how would you like to read this info from a table? A mask table would’t be my choice. Especially if table is big. It is a bit hard to advise you on this when I don’t know why are you doing this; further analysis, reporting or something else…
Anyways one approach could be to use two Numeric Outliers node in parallel and after then use Joiner node to join on Row ID. In first Numeric Outlier use option to replace outlier values with missing values and in second to remove non-outlier rows.
My final goal:
I have a CSV File - and wanna do an outlier analysis. I wanna statistically analyse the outliers. And based on that i wanna go back to the customer with all the outliers and discuss with him if it is really an outlier or if that value could happen in reality.
So basically its purpose is for reporting. I need a basis to discuss with the customer.
Hmm. Not sure. Let’s say you have 100 numeric columns and that 0,1% of that data are detected as outliers. This means that you would go discuss 700 data points with customer. It is feasible but time consuming and not practical in my opinion. If it is significantly less data points then ok otherwise you would need a more general approach.
You can try following. Numeric outliers also outputs Summary data of your data set. You can use as a starting point with your customer (keep it simple at the beginning and develop it together with customer). This data set will have member and outlier count and as well lower and upper bound per each column (you can enrich it with some percentages, graphs in the end output file…). He should know his variables (columns) and give you input you are looking for. For ones he is not sure (this will be case for sure) you can dive in and inspect whole observation (row). Additionally he could give you feedback that you should use different logic (Numeric outliers configuration) for different variables (although depending on what you are doing and what variables you have maybe consistency in outlier detection is preferred).
How to do it in KNIME to get final output? You can use BIRT to get nice PDF or PowerPoint file
yeah i know that will be time consuming. Customer wants it this way. So we have to prepare it this way.
I already saw the summary of the numeric outlier node. Yeah i am able to see the outlier count. But the customer needs to know the values behind the outliers.
My plan was to extract them and then visualize them - 1 plot per parameter/column.
I could do the discussion with the customer in KNIME directly with an interactive plot but i first want to be able to extract and highlight only the outliers.
Is there any way to get the data behind the outlier of the numeric outlier node?
Do you understand my wish or should i try to reformulate it.
Thanks for the hint with BIRT. I will have a look into it.
I’m not @ipazin but I might have a solution for you.
First I just want to summarize my understanding of your use case:
you have a big table and want to detect outliers.
you want to collect information on those outliers to review with the customer to determine if they are accurate values or errors.
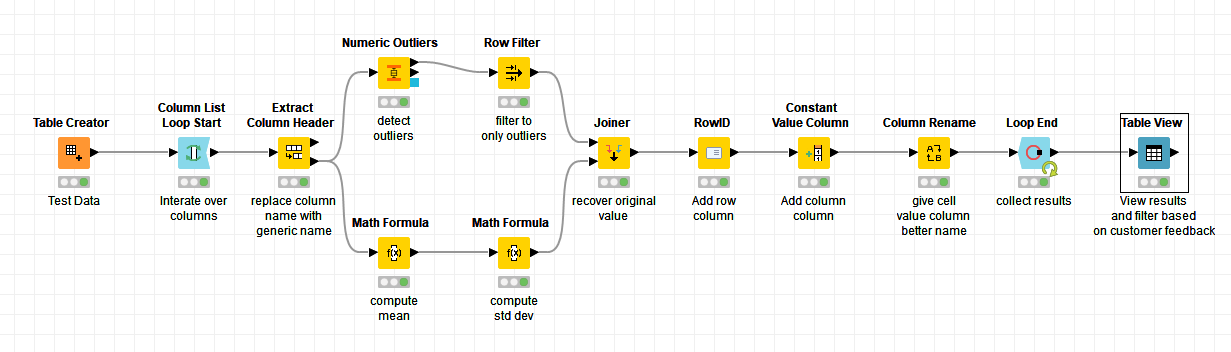
I threw together a workflow that will loop through the columns in your table and collect information on outliers. In my example it saves the original value, the average column value, and the standard deviation of the column.
This is then presented in a table view where you can select which outliers are true errors and which are just unusual data points.
Let me know if I’ve understood your problem correctly, a more exciting visualization is definitely possible at the end but I just left it simple.
Best of luck!
Corey.
sry for a delay @mforrer and tnx to @Corey for providing workflow! Had something similar in mind.
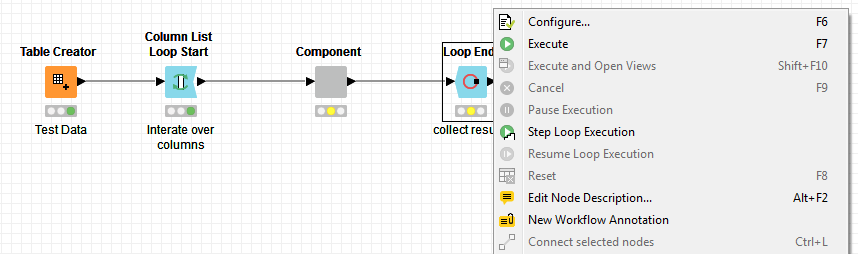
Just to add one thing that could be useful to you. You can add Table View (and other JavaScript view nodes like Box Plot and Table View of Numeric Outliers summary output port) inside a Loop and create a Component from all nodes within loop. This Component will then provide a nice visualization for each Column. Then using Step Loop Execution on Loop End node you can see one column at the time with your customer.
Sorry for the late reply.
But i just wanna thank you for your help and the workflow you provided. That was exactly what i was looking for.
I had a good and constructive discussion with the customer.