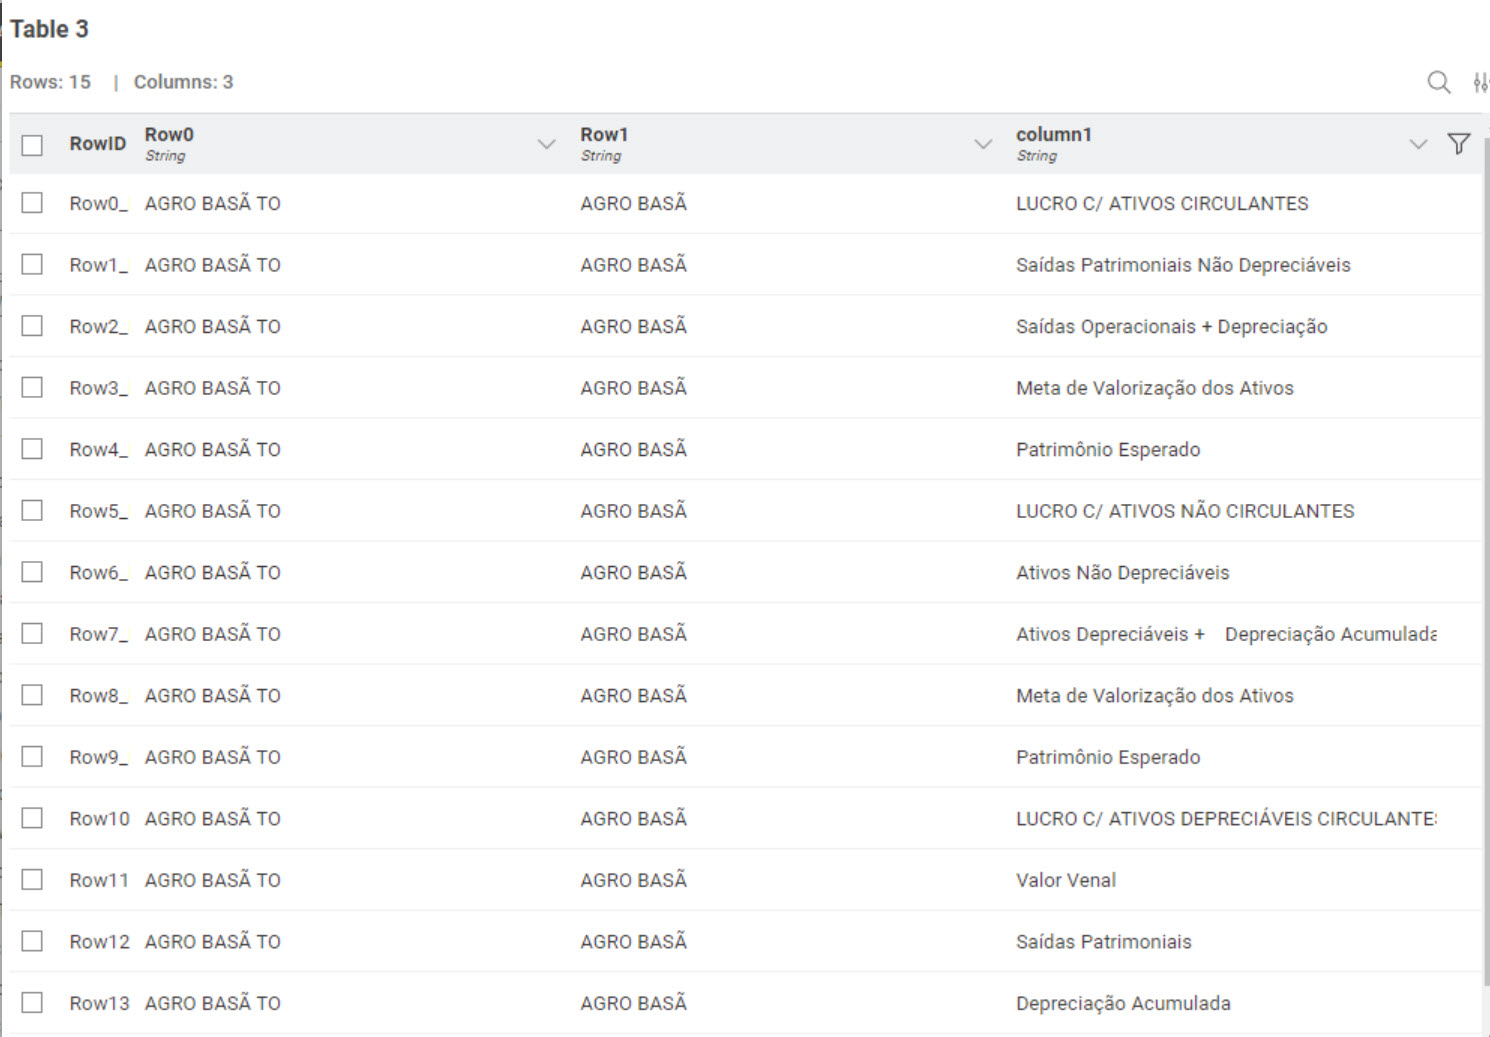
Your request wasn’t very clear, especially for the final table. Check these tables and let me know whether they’re correct or not. I’m not going to post the workflow until you get back to me. There’s no point cluttering the Forum with stuff until I have a better idea what you want.
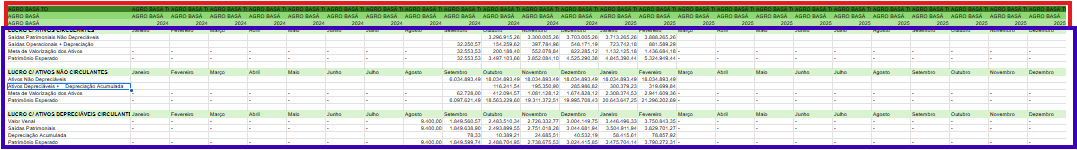
Ok, I’ll try to start over so that it’s clear and I’ll use a simpler table. Once I find the logic I can apply it later, I need to create a data table. With all the data separated correctly by column, my main challenge is to simply transfer the lines that are currently year, unit and month to a column and leave the ones that are currently in a column the same way. I tried using Pivot and Unipivot but I couldn’t get it working.
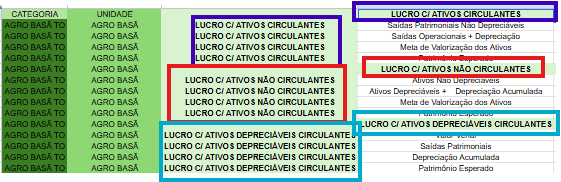
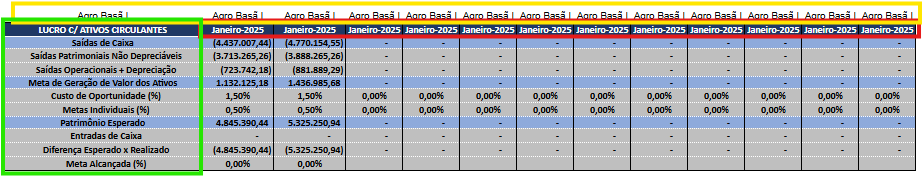
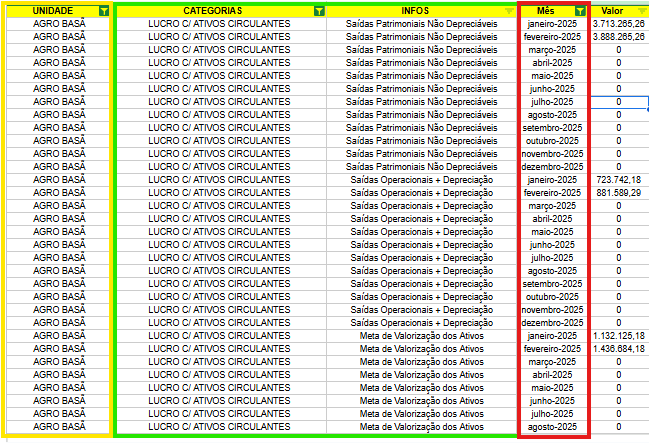
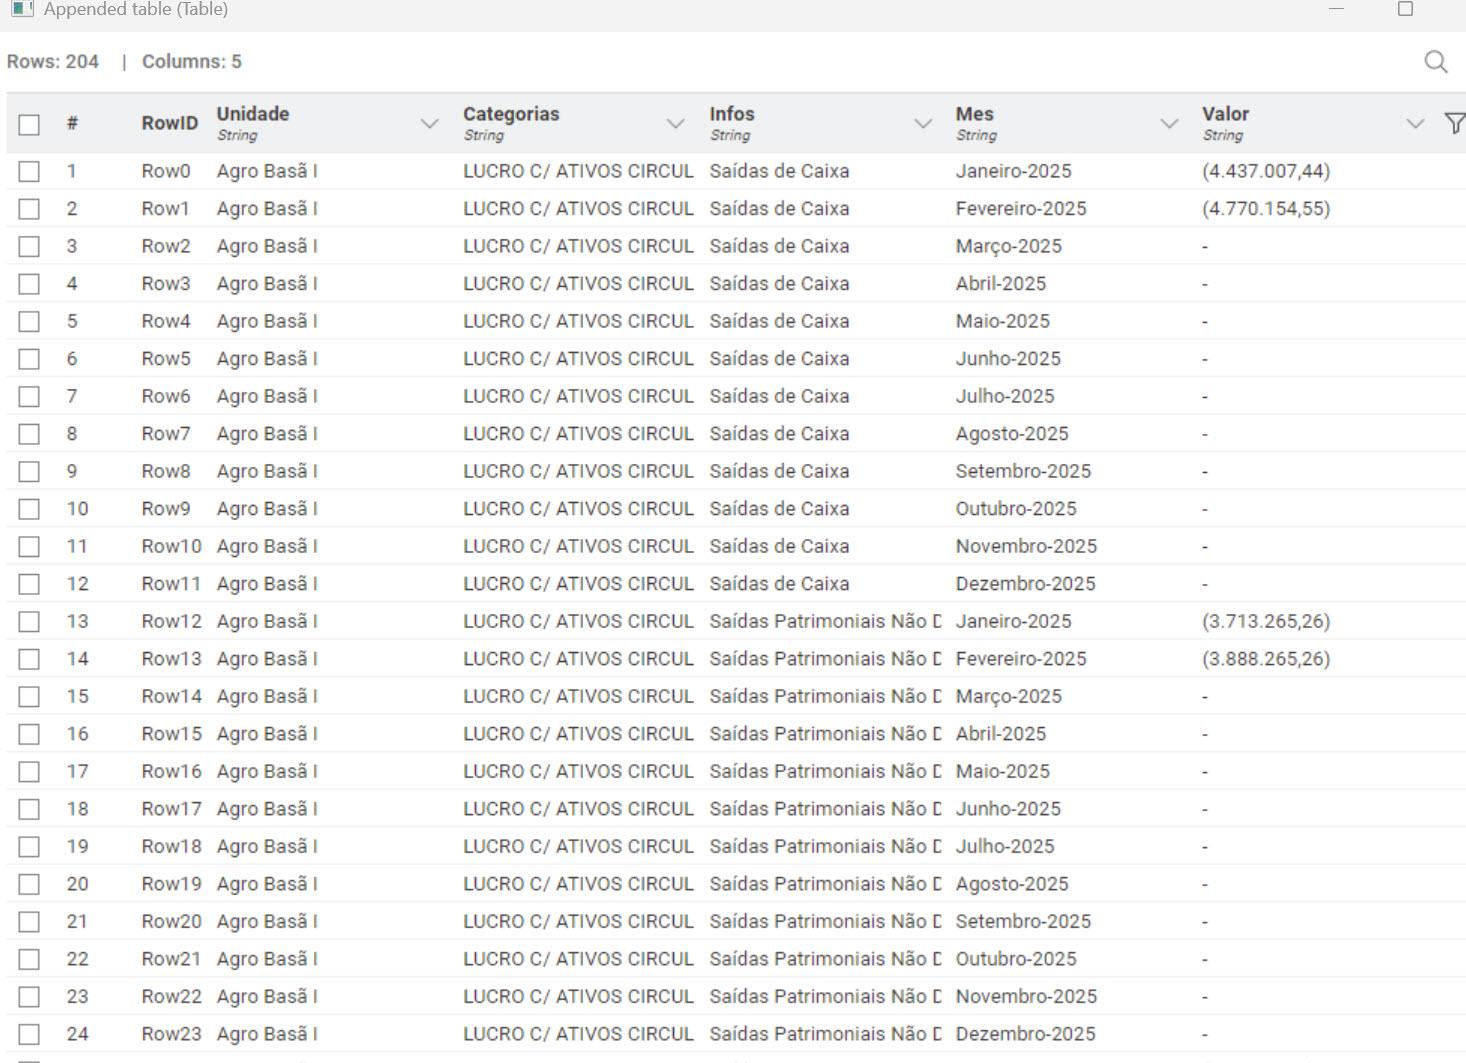
I need the lines highlighted in blue, yellow and red to become columns and the ones in green to repeat for each year, unit and month. See images below.
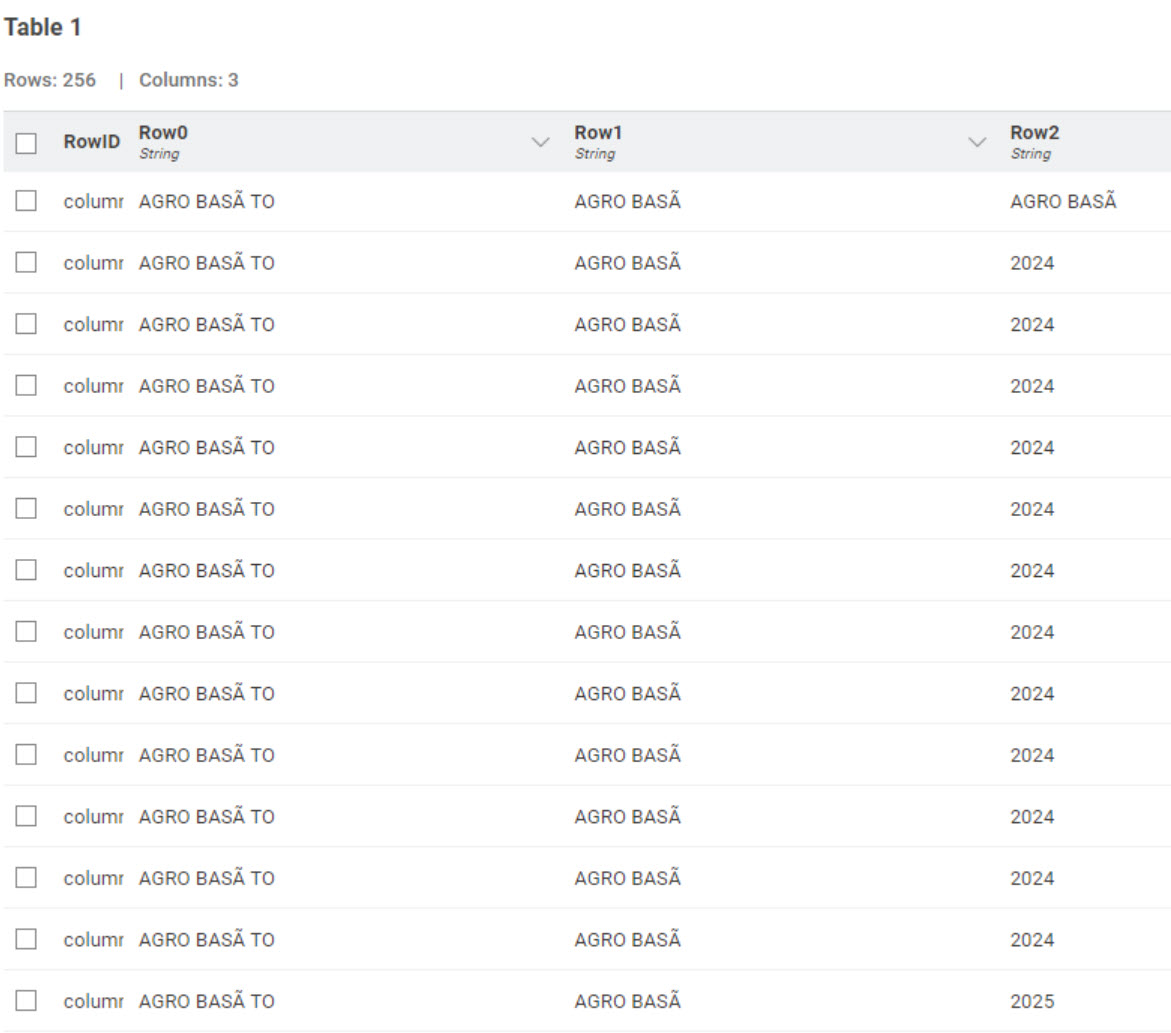
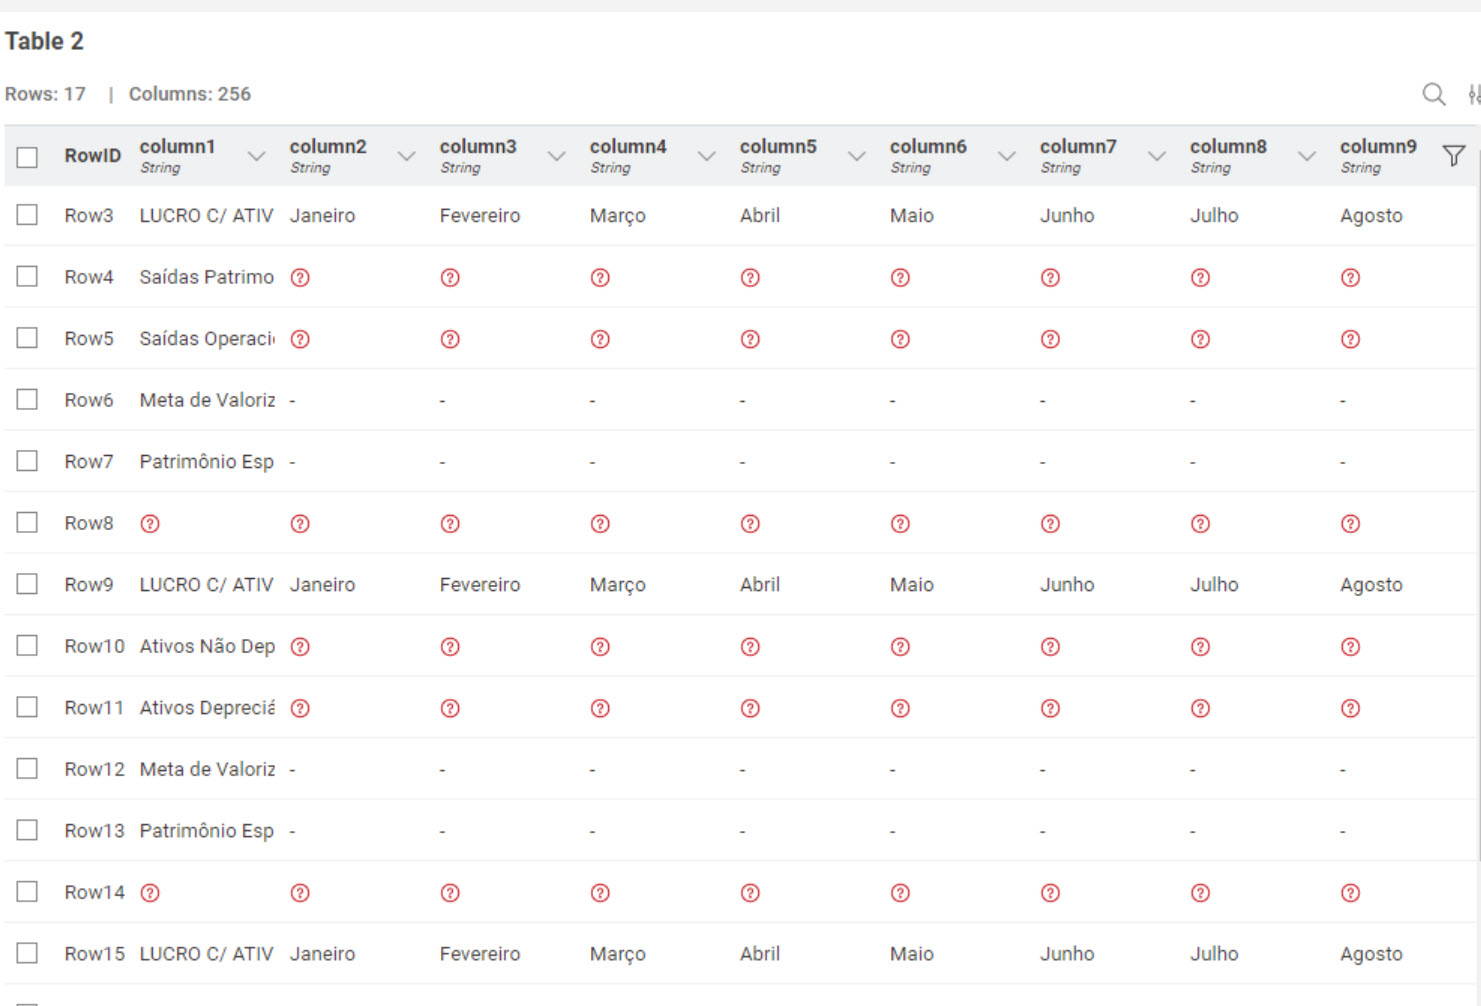
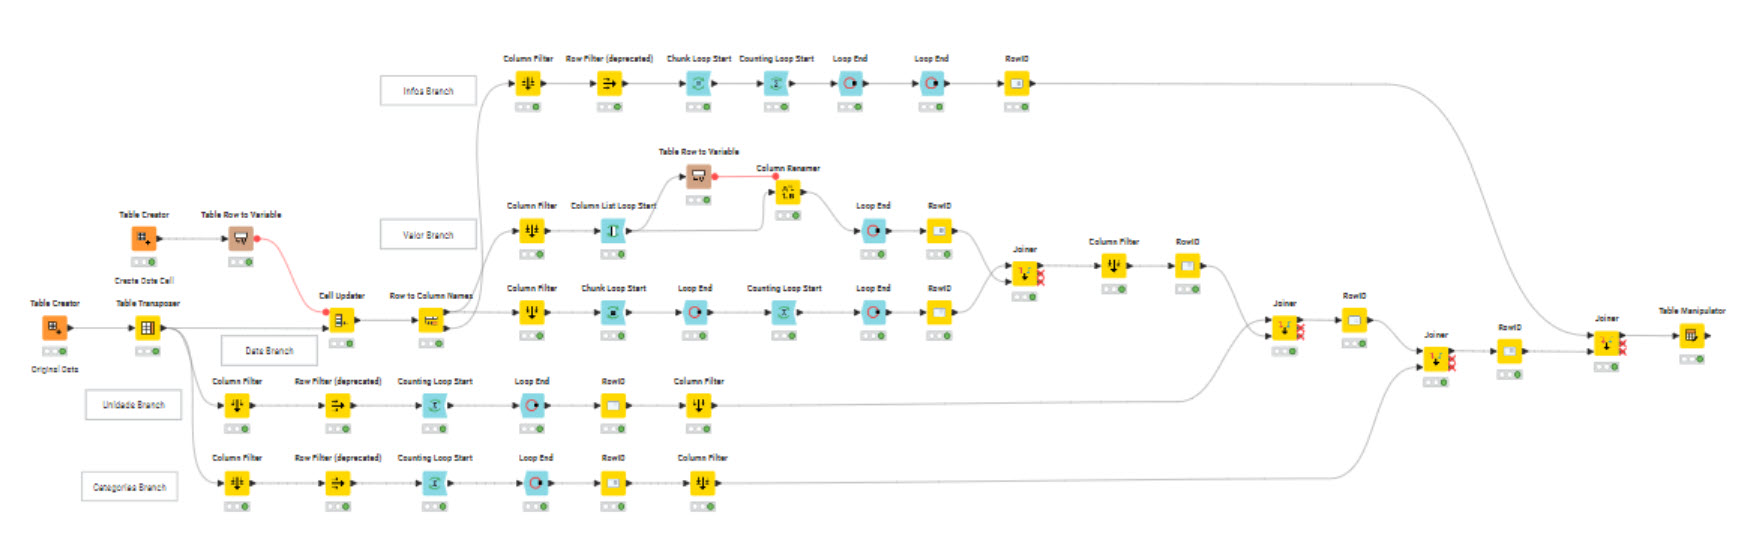
Try this. Its fairly complicated since the only way I could figure out how to construct the output table was to process each column in a separate workflow branch and then join everything. Maybe someone smarter than me could develop something more elegant. Frankly, your data is an absolute mess. If you can, you should work with whomever developed the original data format to construct something more straightforward.