hi everybody,
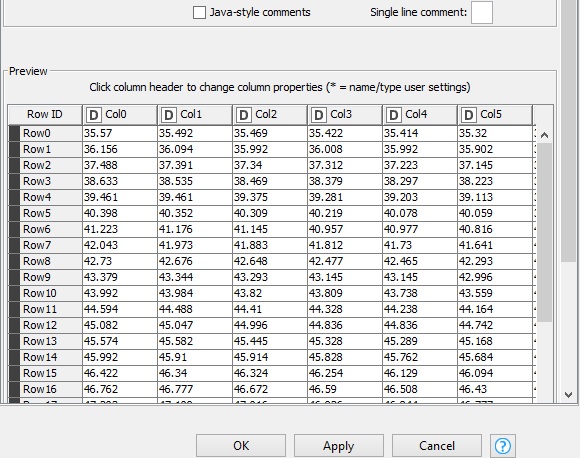
I’ve been trying to make a characteristic time interval of the continuously repeated working cycle(60s) for data of a pressure sensor, data is a matrix containing rows presenting Pressure values in a cycle and 200 columns repeated cycle. I tried create date&time range but failed. !
I will be grateful if you share ur information.
1 Like
Hi there @joan,
welcome to KNIME Community Forum!
To see if I got it right what data you have. One column is one cycle that last 60 sec and values are pressure from sensor? This is some repeated experiment?
Still I’m not sure I understand what are you trying to accomplish. Can you try explaining what would be your desired output?
Br,
Ivan
Hi,
thank for your answer, each row is a cycle lasts 60 second . There are 2205 rows (2205*60) . I want to extract features , here’s the output that I try to achive.
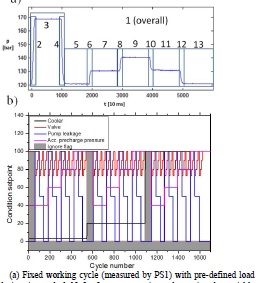
the pic shows the fixed working cycle with a duration of 60 seconds, which is divided into 13 time intervals for which the different features are extracted from the measurement values.
The variable working cycle also has a duration of 60 seconds. I don’t know how can I fix this time interval with
knime
Hi,
Seems sometimes I’m just a bit slow. So 2205 cycles, 60 columns? And what were you trying to do with Create Date&Time Range node? I can help you with that node for start 
Br,
Ivan
2 Likes
sorry it’s a bit complicated I know, I couldn’t achieve the time cycle with that node, here 's my question: how can I define a time working cycle for my rows, first row =first cycle in 60s ?
thanks
Hi there,
what does it mean for you to define time working cycle? Add some information to the first row, downsample the data, aggregate data or something else?
Anyways I not sure how complicated it is but feel free to share more information about it so someone can help 
Br,
Ivan
1 Like
Hi @joan,
it looks like you have an interesting use case, but I’m still confused as to what is your data structure is, how does that structure relate to the figure that you added and what do you aim to do with the data. As suggested by Ivan, if you guide as step-by-step in baby steps we will be happy to think of a solution.
Best regards,
Misha
2 Likes
thanks for answering, I have the raw values from a Pressure sensor,
the system cyclically repeats constant load cycles
that means each row is a cycle (duration 60 seconds), 1 sec each point
I’ve got 2000 cycles,
I want to set time interval for the data, in order to analyze my data in a time frame,
in this pic, u can figure out what I’mtrying to do 
OK I’m curious on this problem… I think you may just need to ‘reverse-engineer’ the data matrix so that you can establish the time intervals.
Let’s first understand the data matrix, then work from there.
If I understand correctly, the image in your first post shows us data which is captured in cycles which last for 60 seconds, where each row is a new cycle and each column is a reading from the same cycle?
If the above is true, and we said the first cycle started at 00:00:00 (hh:mm:ss), then the 2nd would start at 00:01:00, is that correct or am I completely off target?
In my head I’m thinking this is probably easy to help solve once we understand the way in which the data is populated into the matrix - by either looping across then down or down then across the matrix it could be transformed in to a more usable data set.
2 Likes
I appreciate ur answer! that’s true, the first cycle started at 00:00:00 (hh:mm:ss), then the 2nd would start at 00:01:00, I’ve done it before, but when I wanna have my diagram , knime can not understand my time that I defined, I mean no Diagram, no time identification, at least I couldnt catch it. I need to define time as a parameter for my data , do you have any idea?
I’m not sure which specific node might be best, however something along the like’s of this should work…
if rowindex=0 then my_timestamp = '00:00:00'; else my_timestamp=lag(my_timestamp,1)+60;
The idea here being set the value of my_timestamp to 00:00:00 only if it is the first row otherwise take the previous row value for my_timestamp and add 60 seconds… so a transform is being done on the source data.
1 Like
@ ipazin
do you have any idea which node might work?
Hi @joan,
well you can use Create Date&Time Range node to create timestamps sequentially.
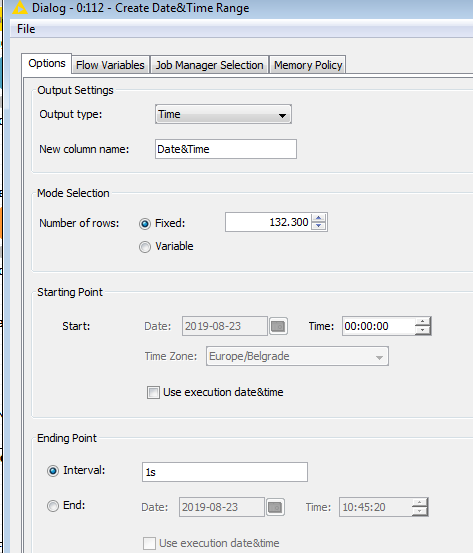
Now if you want to add one column with timestamp containing information when cycle started you need configuration like this:
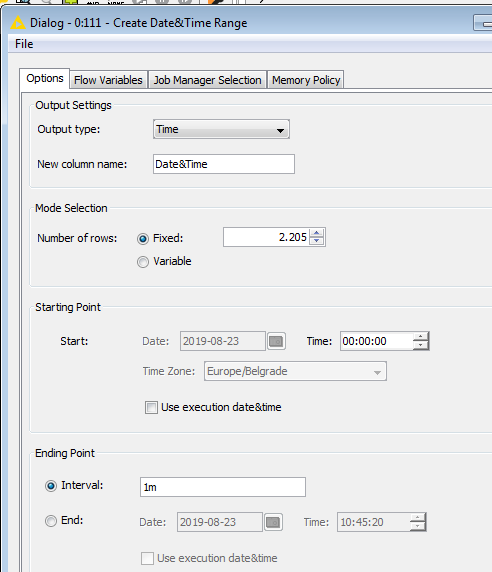
This will create one column with 2205 rows and difference between each row will be 1 minute. Then append this column to your data set using Column Appender.
If you would like to have timestamp for every value pressure sensor sends then you would need to unpivot your data first using Unpivoting node and then use similar configuration:
This will create 2205x60 rows with difference between each 1 second.
Hope this helps you.
Br,
Ivan
4 Likes
This topic was automatically closed 182 days after the last reply. New replies are no longer allowed.