I’m working in a course project where I need to use Knime.
I found the dataset for the project in Kaggle and also the code, but I don’t know to transfer it in Knime and show the same results as in R with the plots. kaggle dataset about polarisation
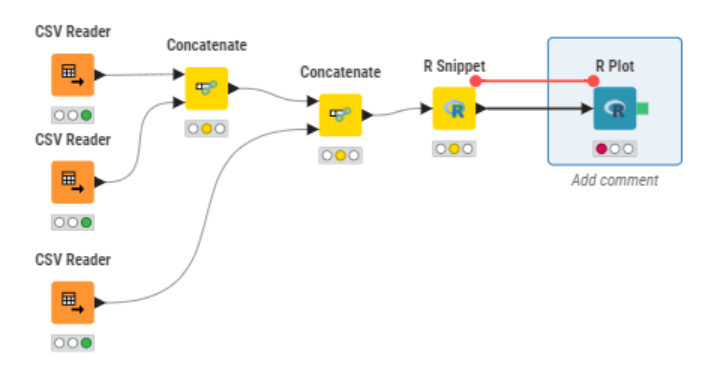
Concerning the R graphics, you can take a look at this example how to implement that:
Since this seems to be an assignment you might want to check if you really should just copy R code from Kaggle or if you might try a few things with KNIME itself.