I’m encountering another problem which is not easily solved via Table Transposer Node.
Currently my table looks something like this:
Country
Images
Templates
Chapters
USA
0
38
1
Belgium
23
2
2
Netherlands
4
345
0
Switzerland
32
21
0
Germany
0
0
54
Austria
0
1
12
Obviously, I need columns and rows transposed. Easily done in Excel but in Knime I’ll encounter the error “Execute failed: Unsupported column type ‘?’”.
I also tried the Column Auto Type Cast Node but it’ll corrupt the data types of the results in the matrix (String instead of integer).
Is there any way I can transpose via Unpivot and Pivot? If so, how may an attempt look like?
I tried switching from String to Integer but it fails because transposing creates a new row header. The former header now is recognized as String like its values below and cannot be changed to Integer.
Where can I find the Insert Column Header Node?
I’m using Knime 5.2.1 and there’s only a Column Renamer (Dictionary) Node looking exactly like the one in your screenshot.
@gonhaddock okay. Thing here is it’s two different columns which originate from a Joiner Node.
How’s it possible to nest the two columns and “unnest” them in the end?
Hello @PeoplesAnywhere
All this would be easier if you can provide some sample data.
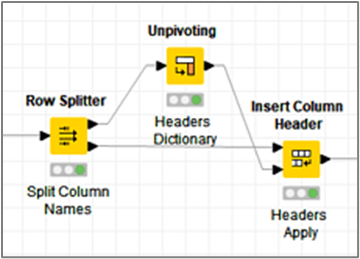
But, it is all about pivots, unpivots…
In the latest image that you posted, the procedure is similar to the workflow. Splitting two rows instead the first, and the string manipulation for nesting just after unpivot the headers dictionary. Then use the nested column as dictionary.
Please find attached a simplified version of the attempt so far.
The Cell Splitter node is set to first and second row.
The Column Renamer node errors because of the duplicates as I haven’t found the solution to nest both headers with the String Manipulation node.
Hello @PeoplesAnywhere
I think we need some more context. KNIME is a data analysis tool; and you are requesting now a specific visualization.
In terms of analysis you can keep the data ‘long’, allowing to keep $Category$ and $Type$ in separated-wise lists; or ‘wide’, and aiming to do so, headers had to be nested. There isn’t an option for double header; you cannot merge upper header either for category sets.
Summarizing, data analysis is arranged in columns, and the requested visualization is arranged in a cell to cell basis as in excel/spreadsheet
In terms of visualization, we are not talking about data wrangling anymore. You would have to create visualization components. For your use case I guess HTML w. CSS coding widgets, they can deliver such type of visualization.