Hi all,
I am completely new to KNIME and I wish to do an sql cube statement in KNIME.
My workflow contains data tables and any SQL editor would not work.
I could do multiple “group by” nodes and then append the datasets but I have 8 columns - and this leads us to 27 combination).
Is there a more simple and efficient way to calculate what is called cube (subtotals per column)?
Thank you so much!
@ChrMavrom welcome to the KNIME forum. You could check out the DB Pivot – KNIME Hub node like in this example:
Maybe you could describe your data in more details and maybe provide us with an example without spelling any secrets.
hi @mlauber71
Thank you so much for your reply.
1st comment, as I mentioned in my description, I have a data table and as far as I know they cannot be connected to a DB node.
My data are like this:
Country_id | Type | Segment | Channel | customer id | order id | product code
1 | Organic | SegA | ChanA | 123456 | 123456 | id2356
1 | ABC | SegA | ChanB | 123456 | 123456 | id2356
1 | ABC | SegB | ChanB | 118274 | 187346 | id2356
2 | Organic | SegA | ChanA | 765321 | 123456 | id4570
2 | ABC | SegA | ChanB | 874019 | 123456 | id9843
2 | ABC | SegA | ChanB | 874019 | 123456 | id9843
and using a group by statement can provide me something like this:
Country_id | Type | Segment | Channel | customer id unique count | order id unique count
1 | Organic | SegA | ChanA | 2 | 2
1 | ABC | SegA | ChanB | 20 | 100
1 | ABC | SegB | ChanB | 10 | 2
2 | Organic | SegA | ChanA | 2 | 2
2 | ABC | SegA | ChanB | 20 | 100
2 | ABC | SegB | ChanB | 10 | 2
but what I want additionally is this:
Country_id | Type | Segment | Channel | customer id unique count | order id unique count
1 | Organic | SegA | ChanA | 2 | 2
1 | ABC | SegA | ChanB | 20 | 100
1 | ABC | SegB | ChanB | 10 | 2
1 | Total | SegB | ChanB | 10 | 2
1 | Total | SegA | ChanA | 2 | 2
1 | Total | SegA | ChanB | 20 | 100
1 | Organic | Total | ChanA | 2 | 2
1 | ABC | Total | ChanB | 20 | 100
1 | ABC | Total | ChanB | 10 | 2
1 | Organic | SegA | Total | 2 | 2
1 | ABC | SegA | Total | 20 | 100
1 | ABC | SegB | Total | 10 | 2
2 | Organic | SegA | ChanA | 2 | 2
2 | ABC | SegA | ChanB | 20 | 100
2 | ABC | SegB | ChanB | 10 | 2
2 | Total | SegB | ChanB | 10 | 2
2 | Total | SegA | ChanA | 2 | 2
2 | Total | SegA | ChanB | 20 | 100
2 | Organic | Total | ChanA | 2 | 2
2 | ABC | Total | ChanB | 20 | 100
2 | ABC | Total | ChanB | 10 | 2
2 | Organic | SegA | Total | 2 | 2
2 | ABC | SegA | Total | 20 | 100
2 | ABC | SegB | Total | 10 | 2
So, practically I need the subtotal for each column I have in the “Group Columns” field in the Group by node.
Numbers are totally random.
Let me know if now it is more clear ![]()
@ChrMavrom I think it would help if you could provide a consistent dataset.
Unfortunately I cannot share the data that I am using.
This is pretty much a representative sample.
is this helpful to you?
DataSet.xlsx (11.3 KB)
@ChrMavrom the point is to have a consistent set of raw data and results os you would be able to determine if the results are accurate. If you just have a few lines a lot of numbers will be 1 or 0 and it will be difficult to decide if the system works until you test it and then come back. It is better to have data that would fully represent your case. It makes it easier …
Could you elaborate what you mean by consistent dataset?
Regarding 1 and 0, yes I am expecting for some unique combinations of country, type, segment and channel to have 0 cases, which will be missing from my data set.
My question is how to create subtotals or rollup for the 4 columns mentioned above.
I have expand the dummy dataset if this helps
DataSet.xlsx (18.9 KB)
you.
@ChrMavrom maybe you could have a look at this workflow and see if this is what you need. you could also employ other measures:

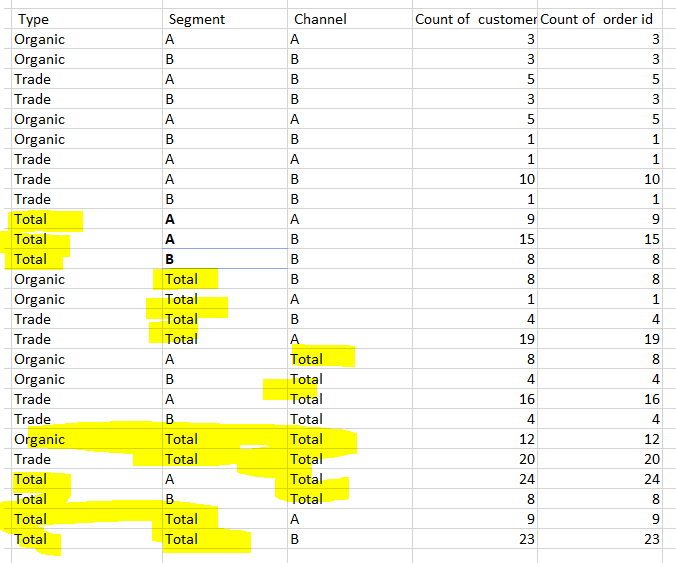
Well, I was looking for the subtotals for each column.
Check the picture attached. Numbers are random. what I want to calculate is Unique number of customers.
Maybe you could calculate the total lines (using group by or equivalent ) separately and then concatenate those to your table
br
Because I need to do this many many times, I was wondering if there is a quicker way.
Either way, thank you for your reply.
From my experience KNIME provides the data processing for the raw data returns the flat file and the aggregation is then done in the data visualization tool (most often automatically depending on the tool)
But maybe someone else has a better approach to your question
br
Hi @ChrMavrom,
I’m hoping that this might assist. I don’t know of a trivial method of creating a cube dataset in KNIME, so I went for a non-trivial method and (hopefully) built one. ![]()
I have uploaded a demo workflow to the hub, using a copy of your test dataset which I cleaned (removing errant spaces in the type column) and stored in the demo dataflow as a csv.
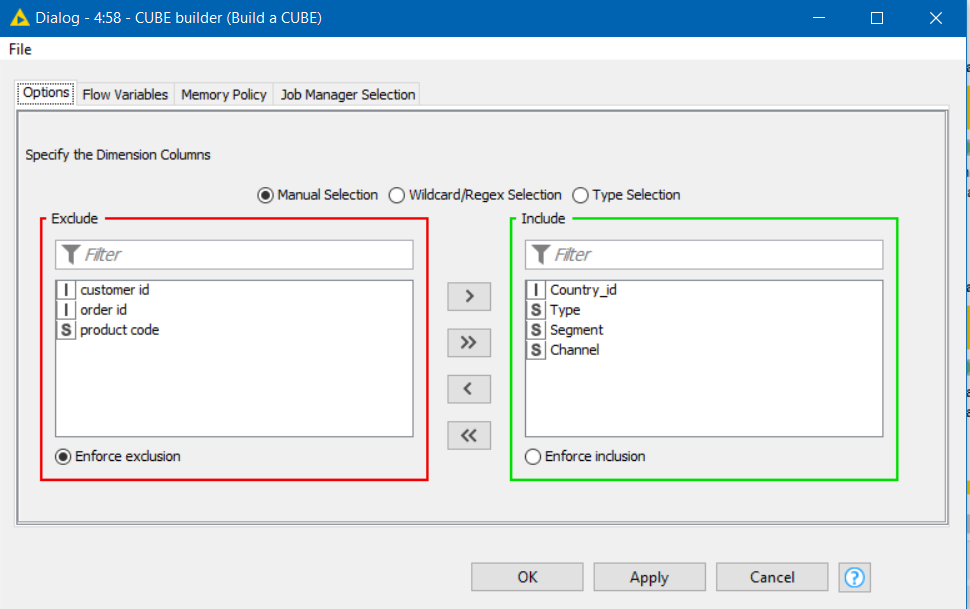
It makes use of a component I’ve created for the purpose, and is hopefully therefore reusable (but I advise some thorough testing to make sure it suits your needs!!)
The component allows you to select the grouping/dimension columns from your dataset and uses these to build a cube.
Data Input:

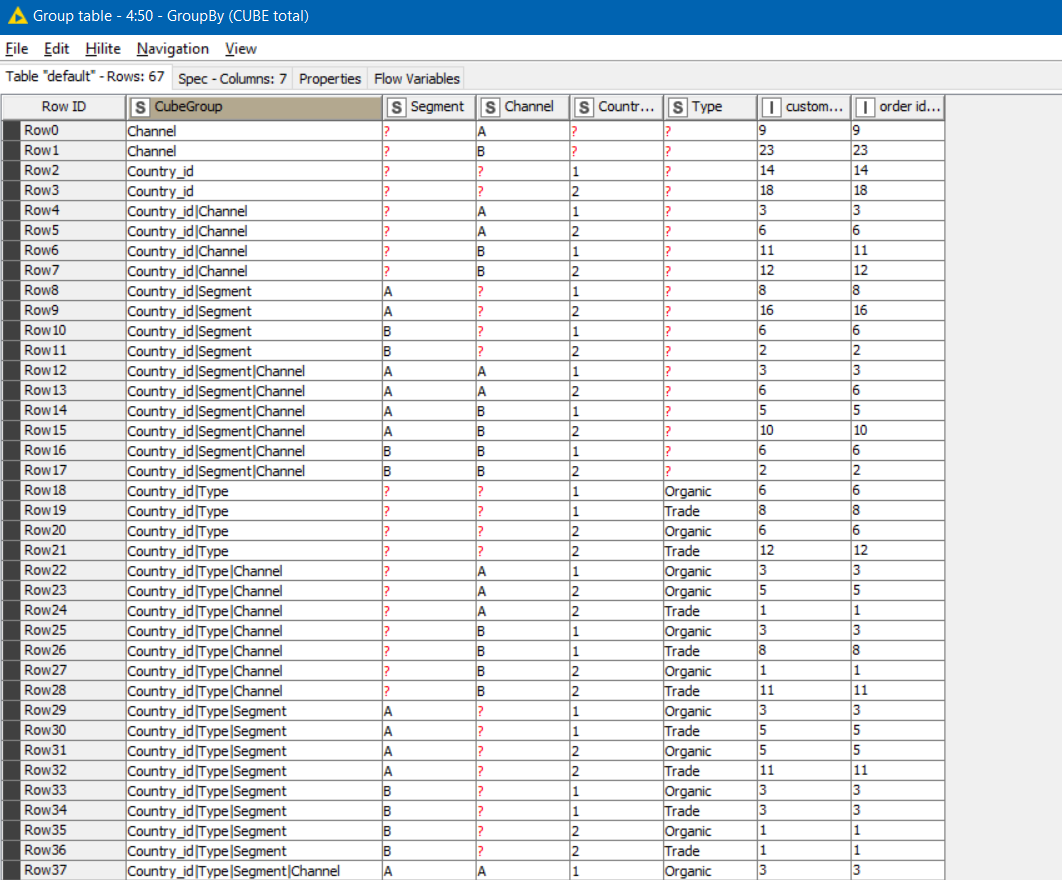
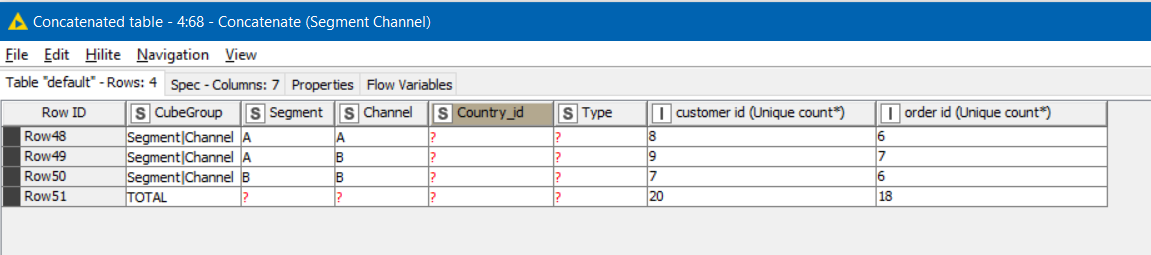
Cube Data Output:
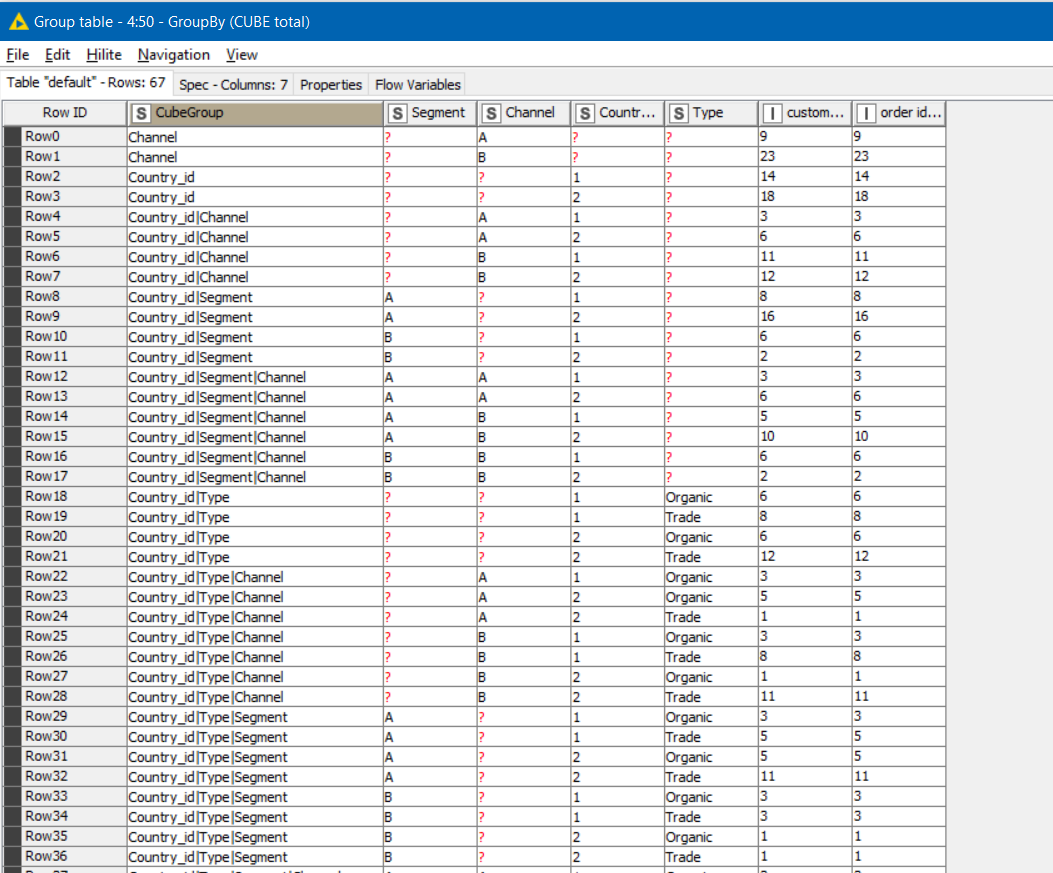
Every row is assigned a CubeGroup which is the grouping of the columns represented in that line
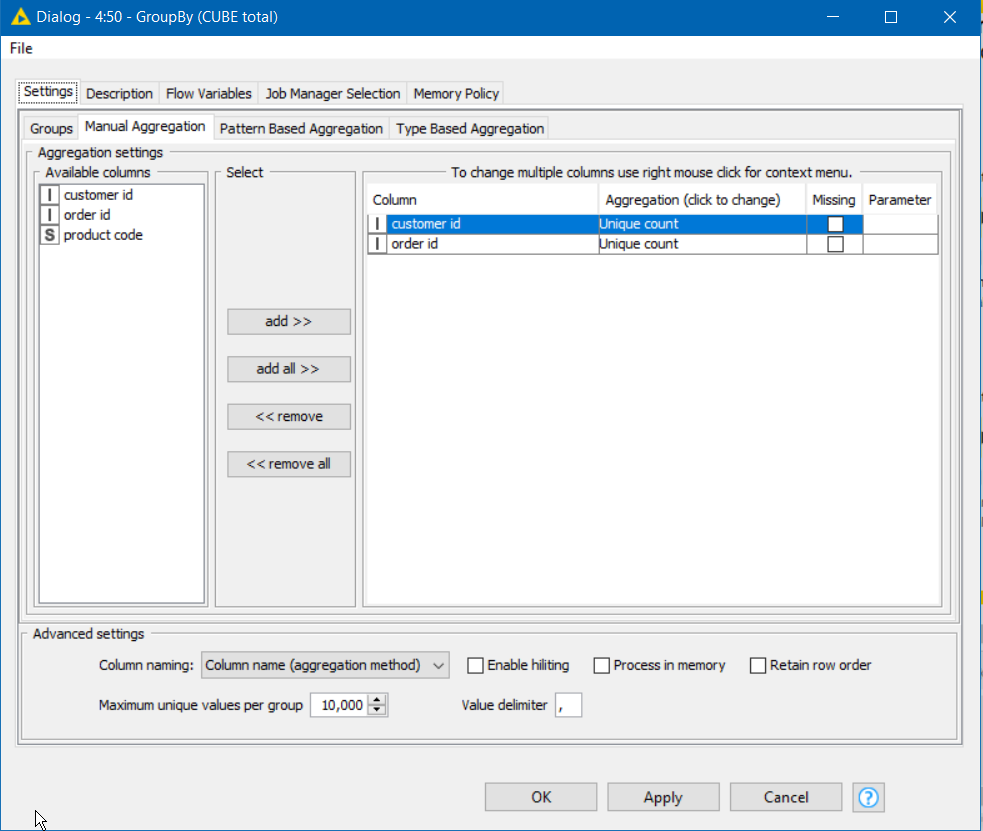
You can then use this “CubeGroup” in a GroupBy aggregation along with the other columns you wish to group by (which should all be columns that were supplied to the Cube Builder as dimension columns.

e.g. to get a UNIQUE count of Customer and Order IDs:
The result is a cube summarised by the different levels
And you can then filter / concatenate different CubeGroups …
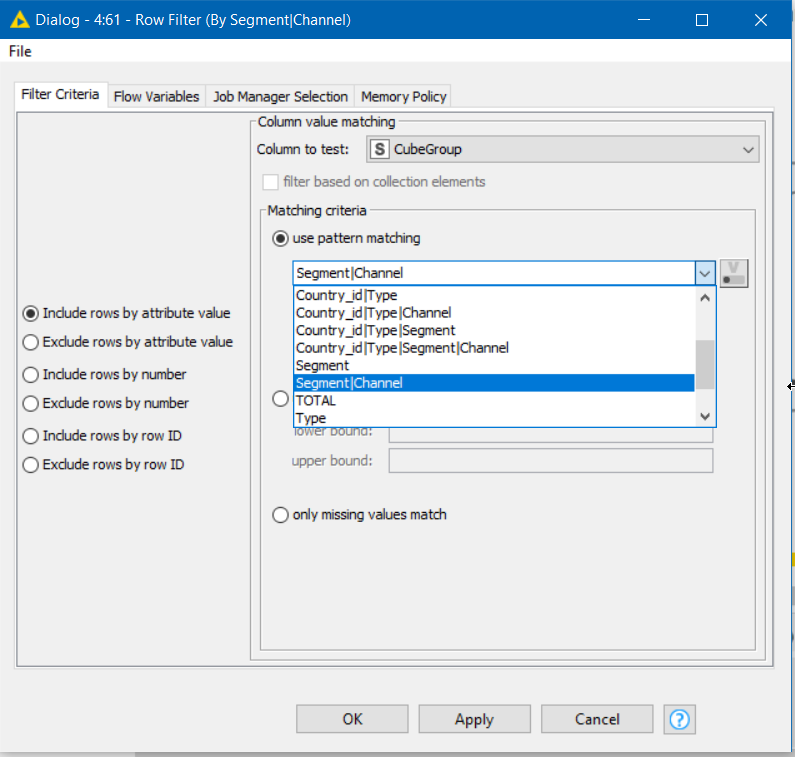
… to build the required outputs:
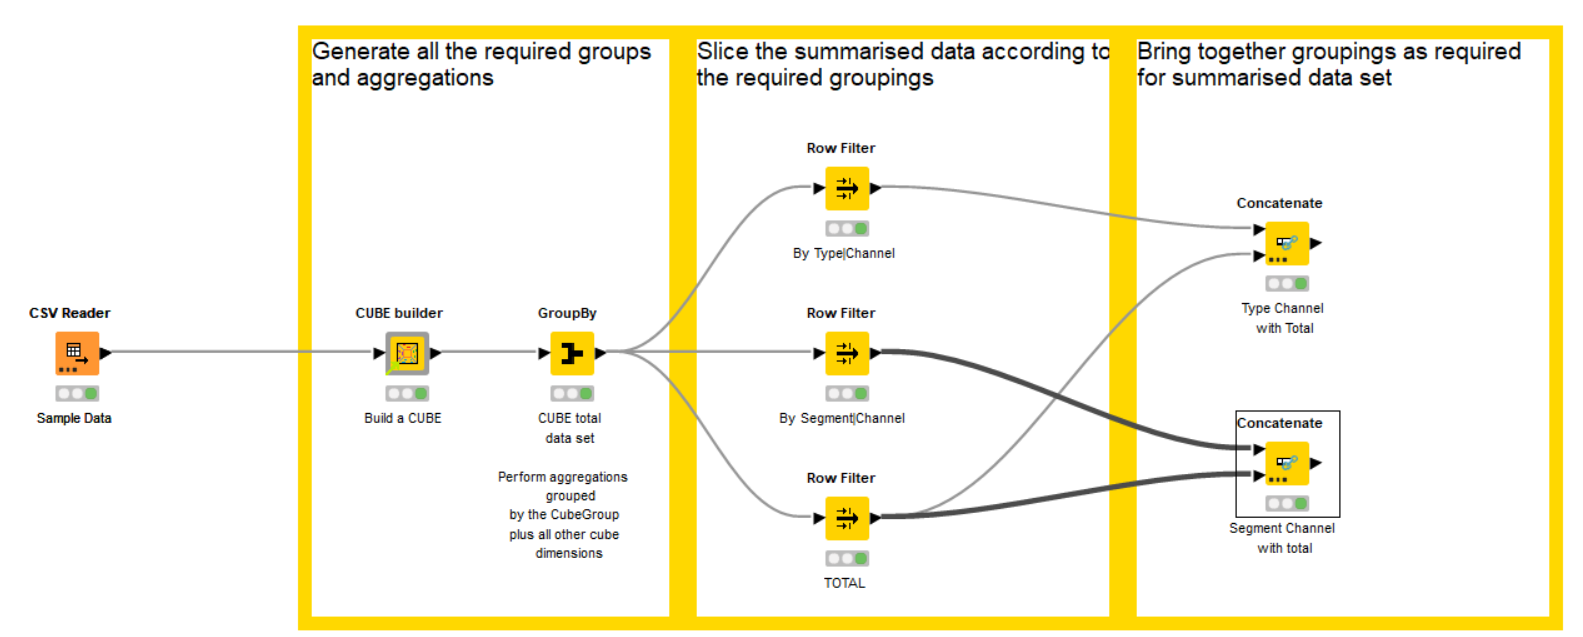
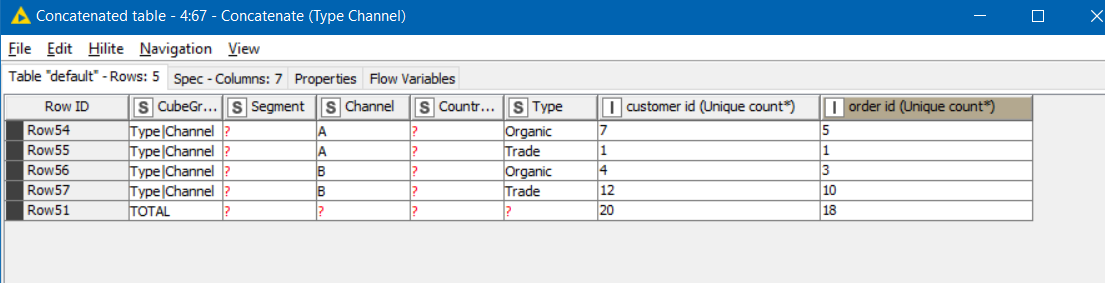
From looking at the result, I see that in the test data, some different customers share the same order id, but… you get the idea ![]()
1 Like
This topic was automatically closed 90 days after the last reply. New replies are no longer allowed.