i would like to know whether there is a example workflow that solves my Problem.
i have 5 Information About a Transaction. The model that i Need should find unsual behavior within this data, for example Aksu Ltd sends mobile phones to Canan ltd from Singapore to Germany.
According to historical data this Transaction in this constellation occurs 20 times.
So now Aksu Ltd sends mobile phones to Canan ltd from Singapore to Thailand or Aksu Ltd sends pens to Canan ltd from Singapore to Germany or Aksu Ltd sends mobile phones to Canan ltd from China to Germany then the outlier model should find These Transactions. This means, if the sent good or the sent Country or the Destination changes, then the outlier deetection model should be able to identify it.
Not sure if it will work, but perhaps you can try the following: convert the categorical columns to numerical ones using the One-to-many node, and feed the new columns into the Hierarchical Clustering node. If all goes well the outliers should be in “lonely” branches of the tree.
can i also use the category to number node, because i dont know why bu the one to many node doesnt work. KNIME_project.knwf (1.2 KB)
Please have a look on my workflow, i think there’s no getting away from building an isolation forest.
Do you know another way to find These outliers, Maybe something in that waym_074_weka_isolation_forest.knwf (1.9 MB) ?
I don’t think Category to Number will work, because subsequent nodes will then treat the data as quantitative, but your categories are nominal. That’s why i picked the Many to One node, which creates a dummy variable for every category.
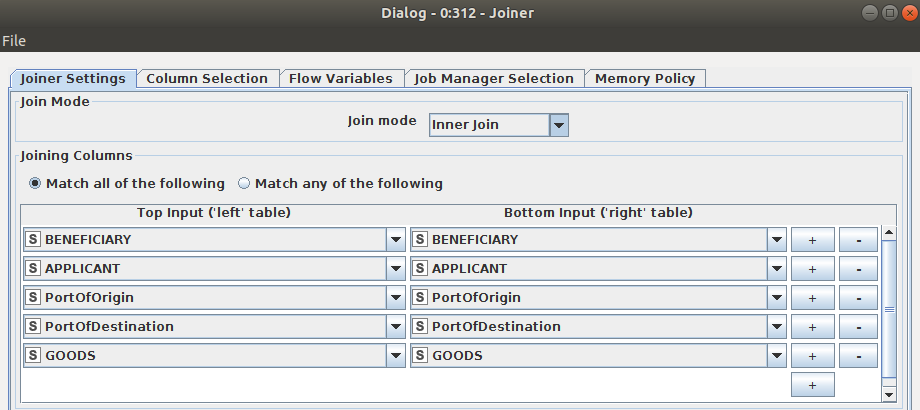
Normal Transaction >= m times of Transactions(BENEFICIARY, APPLICANT, PortOfOrigin, PortOfDestination, GOODS)
Outlier < m times of Transactions(BENEFICIARY, APPLICANT, PortOfOrigin, PortOfDestination, GOODS)
The outlier calculation should find the variable m.
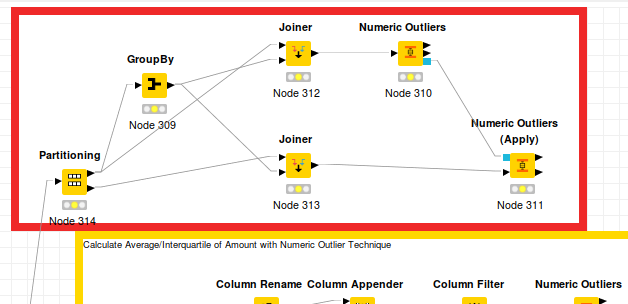
I started with your workflow from the dropbox link and expanded it with this nodes
To got all necessary Transaction Columns I expanded the first Column Filter (Data Selection Annotation) with the Column GOOD.
The Partioning node is a copy from your node in Calculate Average/Interquartile of Amount with Numeric Outlier Technique - Annotation.
With GroupBy I counted the necessary Transaction Columns.
In fact the outliers lie outside the lower and upper bound but from your definition the upper bound is your variable m.
For the usual transaction the Counter value in the Treated table (Numeric Outliers *) is a missing value.
this: “… for example Aksu Ltd sends mobile phones to Canan ltd from Singapore to Germany. According to historical data this Transaction in this constellation occurs 20 (m) times …” is your definition of normal transactions.
Normal Transaction >= m times of Transactions(BENEFICIARY, APPLICANT, PortOfOrigin, PortOfDestination, GOODS)
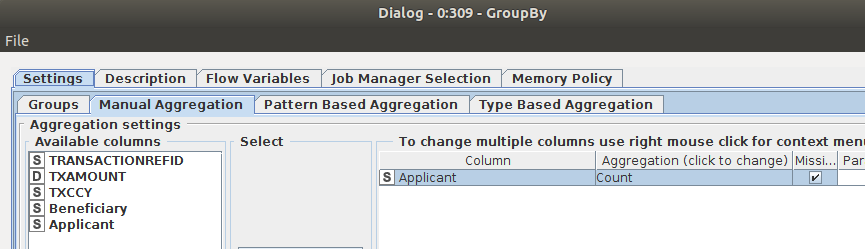
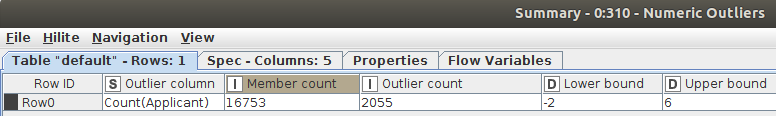
The GroupBy node counted the transaction. As Aggregation Column I used the column Applicant to counted the transactions (see the image Dialog - 0:309 - GroupBy). At the left side you will find Available columns for the count aggregation function. You can use every other column. We need only a column with counted values. The name or the column doesn’t matter.
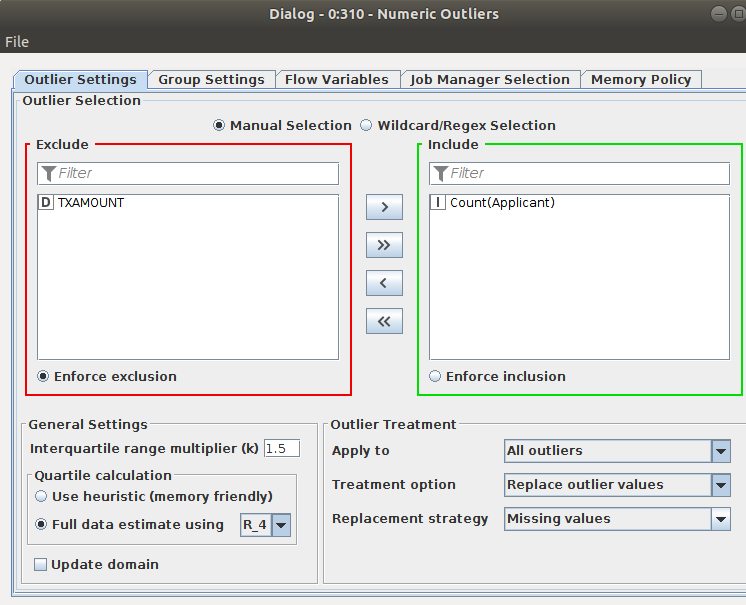
The Numeric Outliers node used this count column to find out the outliers. But in fact, in the summary you will see, that your definition of normal transactions are the outliers in the dataset. Most of your rows are inside the Lower and Upper bound. Only 2055 rows are outside this bounds, which means, the same combinations of (BENEFICIARY, APPLICANT, PortOfOrigin, PortOfDestination, GOODS) includes 7 times or more in your datasets.