I’ve been trying to adapt the Choropleth world map to show a custom set of boundaries (loaded from a GeoJSON) for a current project I’m working on.
I’ve been following Rarylson’s work on github and managed to create the map I wanted using HTML - the code and screenshot of the map can be viewed here.
I’ve been attempting to recreate this map in the Generic JavaScript View node by loading the script from Rarylson with jQuery in conjunction with loading the Google Maps scripts (with API key) but am struggling to get anything to show up. The Knime tutorial on Choropleth maps mentioned that jQuery isn’t always suitable for loading multiple scripts - especially with dependencies, could this be a cause of issues?
Additionally - if there is a way of embedding my functional HTML code into a Knime node that could be the easiest method.
Just today we released two new verified components by @ahmadvarasteh adopting the GeoChart library. You can currently find the components and examples through KNIME Verified Components | KNIME
We update this page so we are going to also post the component links here below:
In both cases examples are available if you scroll down in the KNIME Hub component page.
The new components lets you change the map region (not just displaying the entire world map like the former one we released and you found). You can also change the boundaries and show provinces borders.
Unfortunately neither component offers the option to load custom boundaries. I totally understand your use case. Data is available online in GeoJSON format with boundaries (small custom regions usually) and that could be the only way if what you want to display is super custom and not available as a GeoChart setting.
I would try the following:
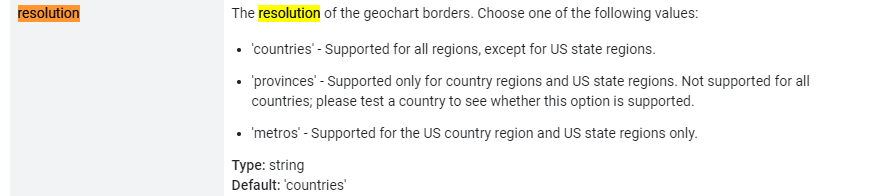
Check whether GeoChart already offers those boundaries using the setting “resolution” either as “provinces” or “metro” and changing “region” on the world area you use case needs to cover. You can check on your own here or take a look at this screenshot from the same page.
If it is covered by “provinces” then no need for coding: simply adopt the new components and adjust the component settings to what you need. (look at @ahmadvarasteh’s examples to see how to do that)
If you require “metros” then you need to drag and drop one of the component, unlink and then edit the JavaScript node inside. There is a flow variable that dynamically change the js setting “resolution”. You could manually change it to “metros” and that should do it +/- a bit of workflow hacking and the proper data input.
If neither “provinces” or “metros” cover your boundary use case, then yeah we need to link into how to import this GitHub library you found next to GeoChart by Google. Let me know and I will give you a few examples after syncing with our devs.
Regarding writing in HTML on which to apply JavaScript: we are aware that unfortunately the generic js node does not offer a place to write your HTML next to the CSS and JavaScript you provide there. There is another node for writing HTML ( that would be Text Output Widget node) but your js code from the generic js node cannot be applied on the html generated by another node. Therefore, until we fix this, you need to write more js code that generates the HTML before applying any further js code. I personally use d3 for this.
So the boundaries I’m using are for specific healthcare regions in the UK so definitely need to load in a custom GeoJSON - seeing an example would be amazing.
All right, I checked with our devs and I found out that:
To use that GitHub approach you need an API from Google GeoCharts.
Our components do not and that’s already a big difference.
Either way you have two methods to import both js libraries in the Generic JS View node:
Using “require.config”
require.config({
	paths: {
		// delete this comment once you have put in your maps key
		"google": "https://maps.googleapis.com/maps/api/js?key=$Put_in_Key_without_the_dollar_signs$",
       	"GeoJson": "https://cdn.rawgit.com/rarylson/geochart-geojson/master/build/geochart-geojson.min",
	}
});
require(["google", "GeoJson"], function() {
	// geochart now available under geochart_geojson
});
Using jQuery getScript()
function googleLoaded() {
	console.log(google);
	$.getScript('https://maps.googleapis.com/maps/api/js?key=$Put_in_Key_without_the_dollar_signs$')
		.done(function(script, textStatus) {
			$.getScript('https://cdn.rawgit.com/rarylson/geochart-geojson/master/build/geochart-geojson.min.js')
				.done(function( script, textStatus ) {
					console.log(google);
					debugger;
				});
			});
}
// Load Google JavaScript API via jQuery getScript()
$.getScript('https://www.gstatic.com/charts/loader.js')
	.done(function( script, textStatus ) {
		google.charts.load("current", {packages: ['corechart', 'geochart']});
      	google.charts.setOnLoadCallback(googleLoaded);
	})
	.fail(function( jqxhr, settings, exception ) {
		// Inform user about failure
		alert("Loading Google API failed.");
});
In both cases there is $Put_in_Key_without_the_dollar_signs$ to be replaced with your Google GeoChart API key.
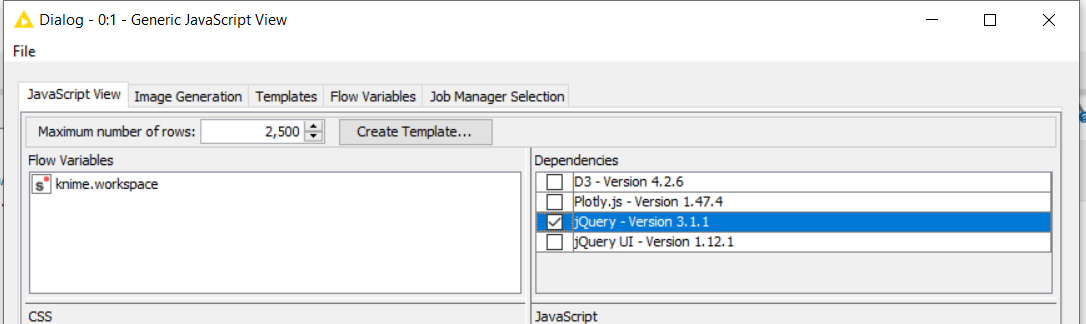
In the second case you also need to check the box in the top of the Generic JS View dialogue as shown below in the screenshot:
Regarding the HTML are you able to write some js code to build it?
Either way if you get stuck send your workflow in here with attached data.
To learn how to store data (the geojson and the table) inside the workflow data area see this example: