I am wanting to use median income per family into predictive models (such as random forest generator, neural network, ECT) as of right now the data set ranges from $13,340 to about $45,000. I’m concerned that just dumping it into the models as is with the dollar sign and the numbers being so large might be a problem. Recommendations?
This very much depends on your other data. You could:
- remove the $ sign and convert it into a double
- if other numeric variables are much smaller in range and you fear this might have a bad influence you could normalise all numeric values to 0.0 - 1.0 so a very large number would not ‘confuse’ a model but still keep the rank information intact
- if you have highly unbalanced numeric values you might use a logarithm to ‘stretch’ or ‘lift’ the middle part while again keeping the rank (keep in mind here you cannot use zero or negative values you might have to convert missing to something like 0.01 and 0 to 0.02 if your business case permits that)
- you could use feature extraction techniques like PCA or R’s vtreat to turn several variables into a reduced set. You ‘pay’ with reduced interpretability
I would advise agains using income data as a collection of strings.
Ok. I have removed the dollar sign and instead dropped a decimal in the place of the comma to shrink the number down and keep the whole value. For example $34,952 is now 34.952. I could round it to make it 2 decimal places if needed. On a side note I noticed that some are string, others integer, double, ECT. I can change that in the file reader so another question is what is a string and how do I know to assign something as a string?
This sounds like you might need to do some data cleaning. You could try removing unwanted whitespace and characters in order to preserve the number. But you have to decide from your data if there might be problems like
$ 30,000
$ 35k
where in the second case the information might be lost. You will have to come up with a system to keep as much of the meaning as possible. If you could share the data we might have a better look.
After the cleaning you could just convert the string into a number. Any remaining string will be converted to null. You might have to decide with how many missing you can live.
Gambling - Data Set.xls (422 KB)
Here is the data set that I am working with. the tough one is the income. Basically I am trying to predict if a gambling law will pass in different counties or not. I already have what variables I want to use on another excel, as not all of these are good to use such as number of churches (but I am using % of people that are members of a church), ect. On the other spreadsheet I have already cleaned some things like changing the "dependant variable’ column to , to ‘Vote Outcome’ and then changing the 1’s and 0’s in that column to ‘y’ and ‘n’ to show if it passed or not. Choosing what to make strings is something else as well since I don’t know exactly what a string is. When I partition the data I have noticed that it will only let me stratify by the different strings
Basicly I’m just looking at what a ‘string’ is as well as what to do with the median income numbers. I really appreciate all the help so far
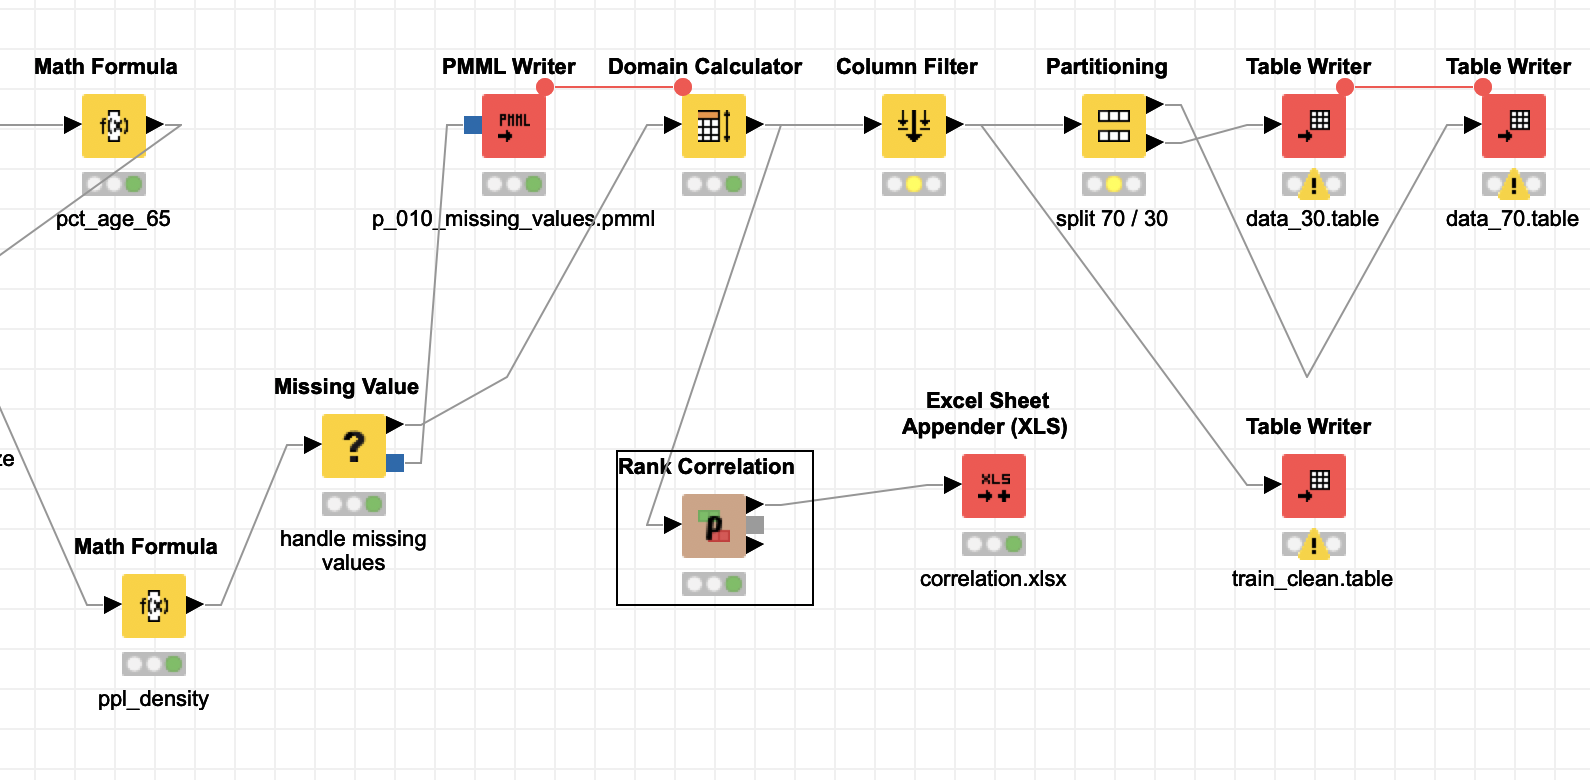
It seems that after importing the Excel file you are mostly fine with your data, the $ come out as numeric, and the two remaining columns you can convert and I can find no missings. You can then calculate % of population to give you relative parameters that might tell you something about the demographic.
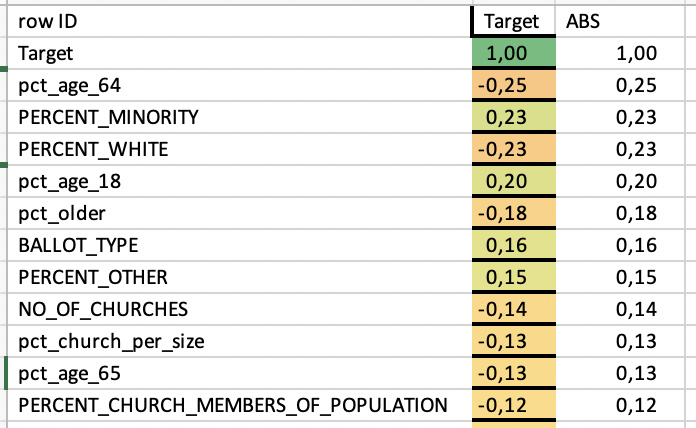
A quick correlation then shows what one would expect. More elderly and more churchgoing people present means a vote pro gambling is less likely.
gambling.knar (913.4 KB)
1 Like