Hello! I’m trying to compare data from a variety of schools in an interactive dashboard. My end goal is to be able to choose a few schools to compare and then have a pie/bar chart pop up for each school that I selected. Is this possible? I set up a multiple selection widget but I’m struggling to get the visual aspects to work. Do I need to make a loop to compile the images for each school?
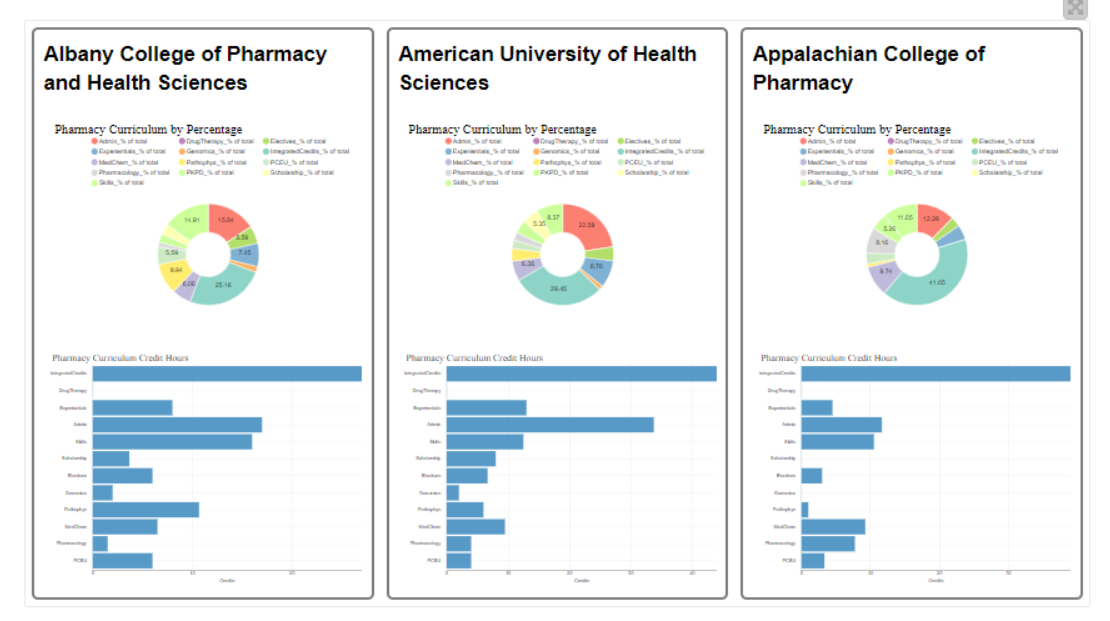
I was able to figure out how to set up a loop to collect and compile all of the pie charts and bar graphs as images. I then joined everything together and used the “Tile View” node to view the results in my dashboard.
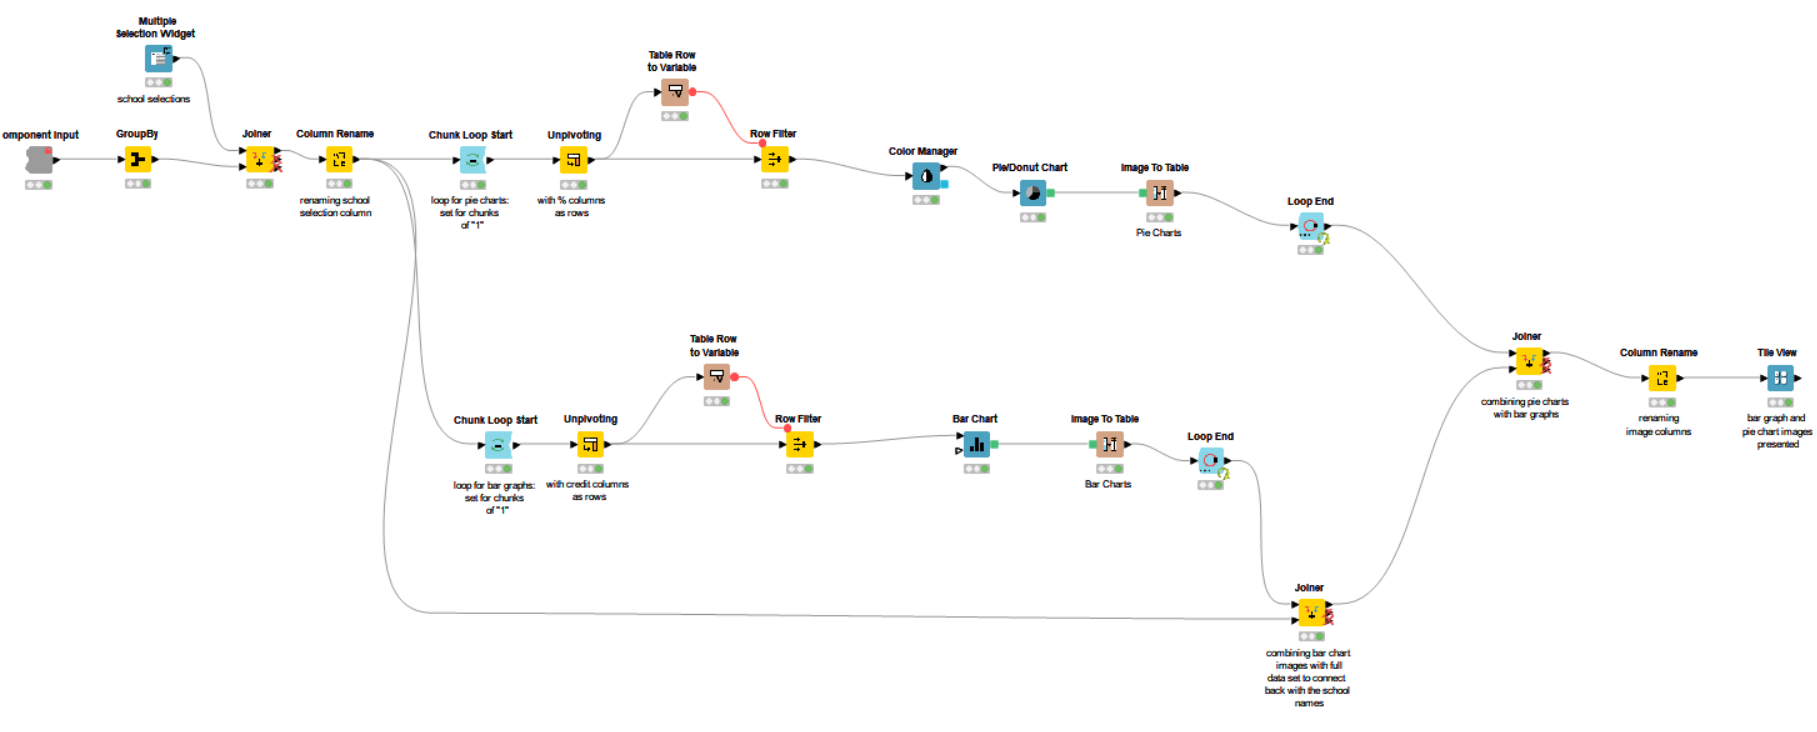
Since the Tile View node is just using the images produced, it is no longer as interactive as putting the original bar graph or pie chart in the interactive dashboard. Is it possible to have a similar display but with interactive visuals?
4 Likes
Hi @ciarroccacm -
I just wanted to say you have made really nice progress on your task already ![]()
So it seems your current approach is to create static images via loop and arrange them via tile view. You are right that you lose interactivity in this way.
If you wanted to maintain the interactivity, you could use multiple Pie/Donut and Bar Charts inside a single component, but this probably requires that you have a separate branch in your workflow for each university you want to display. Of course if you have a lot of universities to show at once this becomes unwieldy quickly.
How many universities are you trying to display at once? You might be able to limit the number of schools to, say, three at a time with an upstream widget - and then include a refresh button to switch to views of other universities. This would get rid of loops altogether, along with the Image to Table bits.
If you are able to upload your actual workflow with some sample data, maybe someone could provide an example of a more interactive data app.
3 Likes
Hi @ScottF,
My initial approach was to use multiple workflow branches to create the charts before I tried to utilize the multiple selection widget. It’s possible the multiple selection widget just isn’t the best choice for what I’m trying to do. I did add the refresh button for the multiple selection workflow and it greatly helped with some other issues I was having with my system lagging from the re-executions, thank you! I’ll have to decide how many schools to limit my selection if I’m not able to make it interactive with no limit for the number of selections.
I have created and attached the workflows with sample data:
Sample_Curriculum.knwf (95.5 KB)
Hi @ciarroccacm , the workflow wasn’t exported in an executed state. You’ll have to untick the box saying ‘Reset workflow’ during export.
1 Like
Hi @ciarroccacm,
I would love to help you with this problem.
Let me ask a few questions:
-
Can you supply the data? The workflow won’t run without it.
-
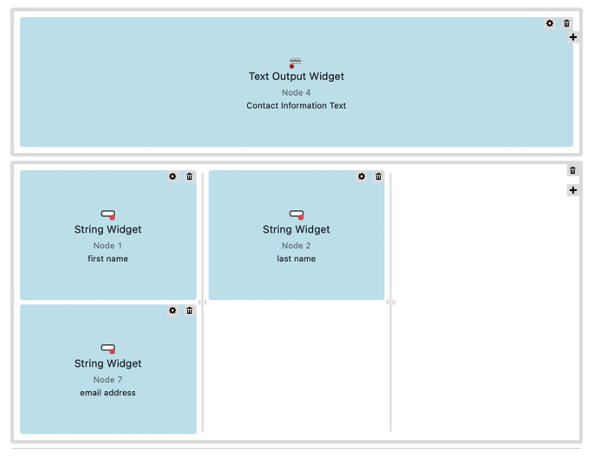
Have you tried editing the layout? See below for how this works:

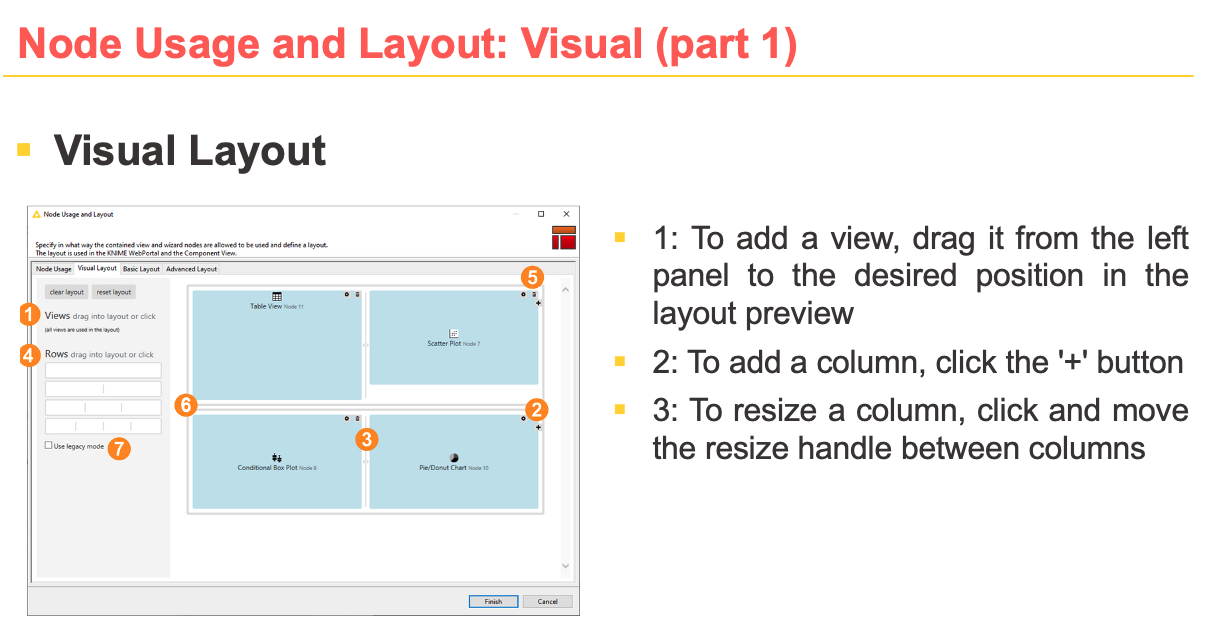
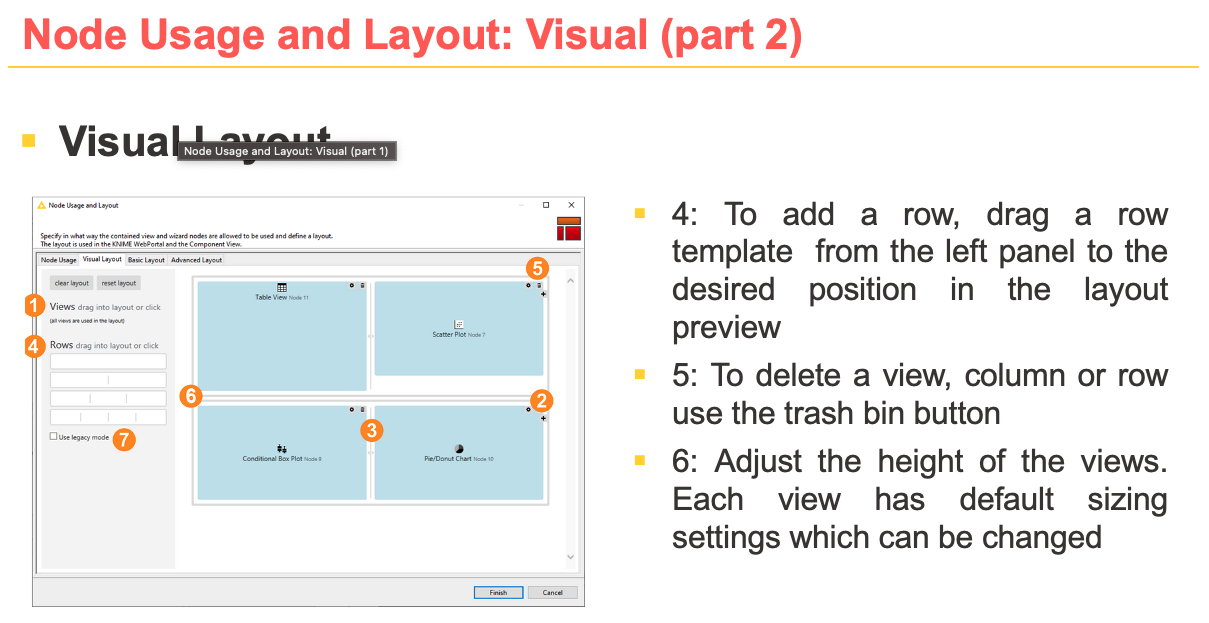
In my mind, I’m envisioning you split your graphics something like this:
More References:
You can also see the graphics cheatsheet
1 Like
Here is the workflow in the executed state: Sample_Curriculum.knwf (358.7 KB)
I have played around with editing the layout. My issue is more trying to allow an unlimited number of selections from the multiple selection widget and getting the interactive views for each selection. The only way I could get compiled information from all of my selections was to create a loop but I had to change the interactive graphs to images for it to work. I could leave it with the individual workflows to create graphs and limit my selection but I would really like to not be limited if possible.
1 Like
Dynamically making graphics (unlimited graphics) is not something I’ve seen KNIME do before, so instead you can specify a set number you allow students to see at once (for instance 3). Then they choose which 3 schools and can see them interactively. We will need to do what’s called sequential logic.
2 Likes
That’s good to know, thank you! I will just limit the number that can be selected.
1 Like
@victor_palacios Thank you for sharing that link! It opens up a lot of opportunities to my current & future interactive projects.
1 Like
@ciarroccacm If I can rephrase your words, would it be accurate to say that you’re looking for an advanced version of Version 1 in the workflow, where, rather than limiting to comparisons between two schools, you’d want the user to be able to do multiple comparisons of any number of schools if that’s what they want. Is that correct?
@badger101 Yes, that’s a great way to rephrase what I’m looking for!
Hi @ciarroccacm Thanks for confirming, I’m working on it now. Your total number of schools is only 20 right (assuming the workflow you provided contains the real dataset you’re working on)?
Because if it’s only twenty, a loop approach is still considerable. Too many schools (>100) will require a different approach.
@badger101 I cut out a large chunk of the data to upload the sample workflow for it. My full data set has 144 schools.
School Interactive.knwf (74.0 KB)
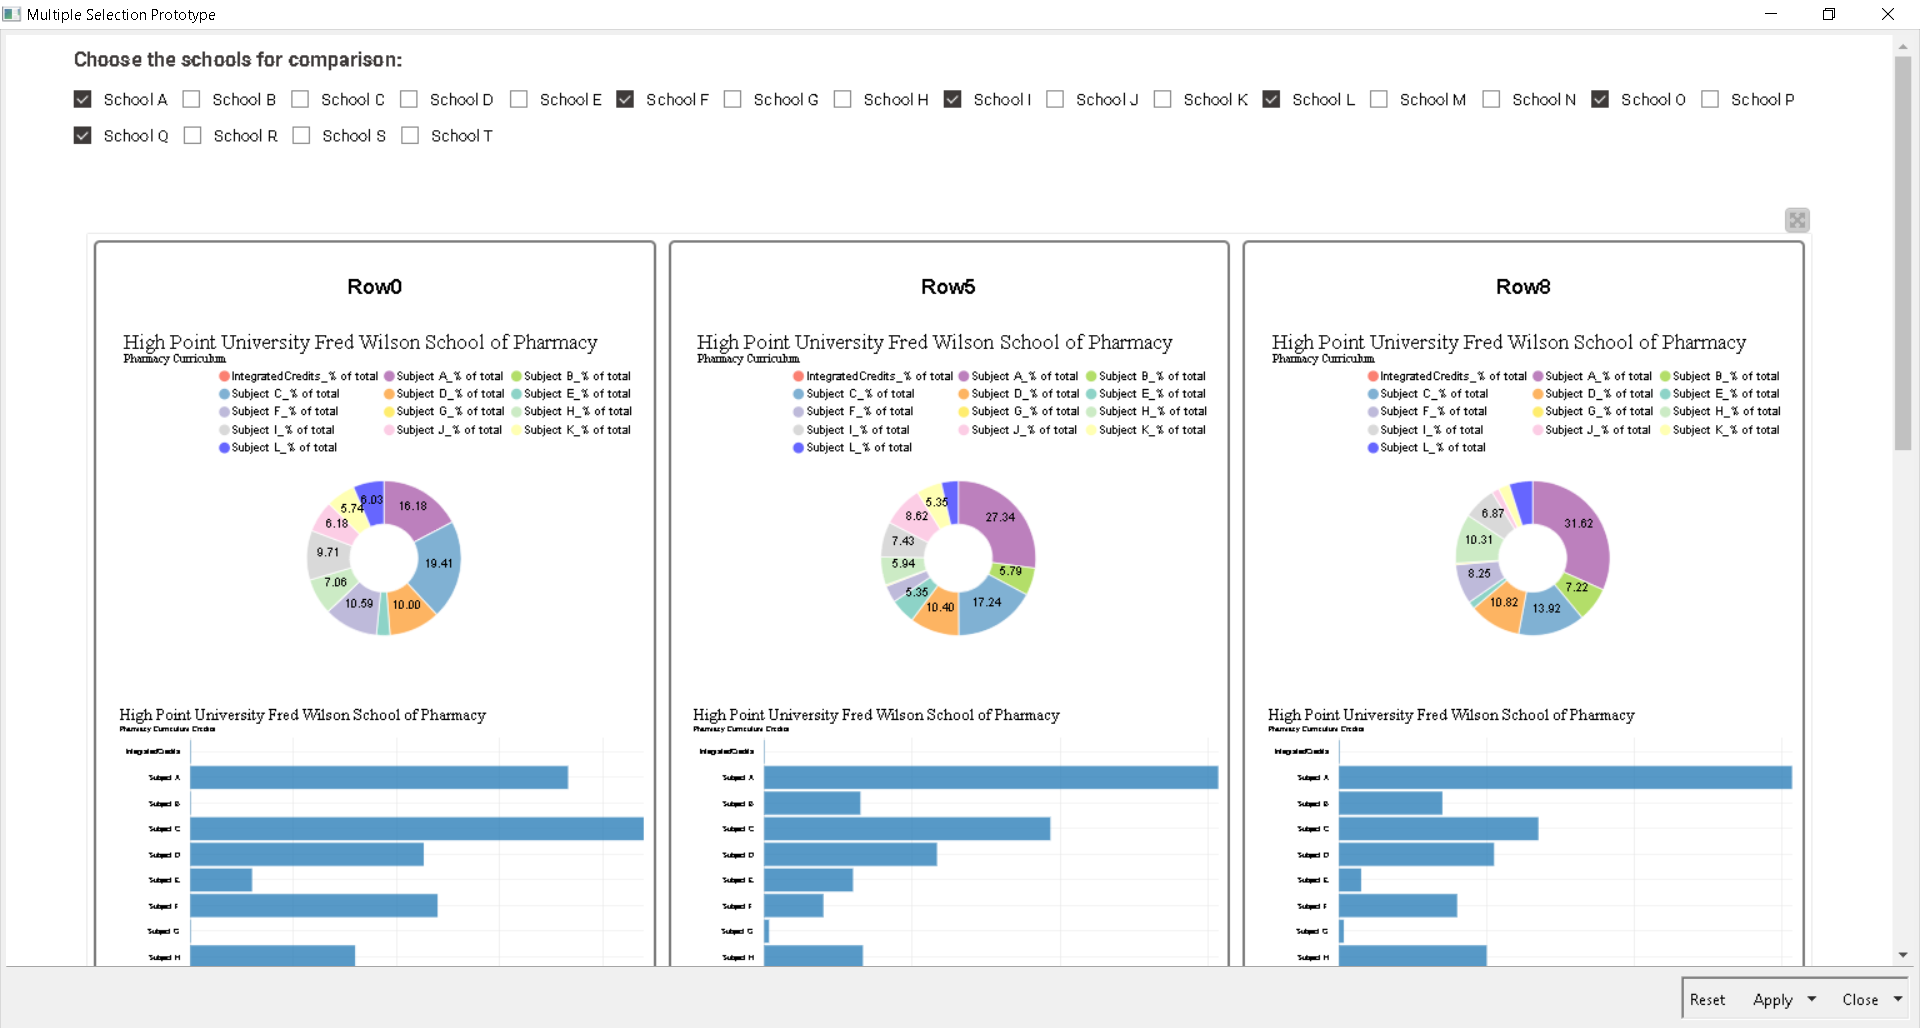
Okay, this is a modified version of your Version 1, giving almost the same effect as in your Version 2 but with a different taste.
If you interpret ‘interactivity’ as ‘a page that refreshes & updates itself whenever additional boxes are ticked or unticked’, then this is the one.
Regarding the loop issue, for 144 schools, it’ll take you a few minutes to loop through each school. But the good thing is once the looping part is done, it won’t be repeated during the interaction activity and thus won’t bother you.
I’m not sure if this satisfies what you’re looking for, but I learned new things when doing this. So, I’m happy either way ![]() Hope it’s a useful sharing still.
Hope it’s a useful sharing still.
1 Like
@badger101 That’s pretty similar to my Version 2, I like that you used the column appender node so you just have the one loop instead of my two loops. I’m trying to not turn my graphs into images so you can still scroll and click on them like in Version 1 but I don’t think it’s possible based on earlier comments. Thanks for helping me clean up my loops though!
2 Likes
No worries! I’m afraid that’s the top of what I can do. But happy to contribute to the cleanup!
1 Like
This topic was automatically closed 7 days after the last reply. New replies are no longer allowed.