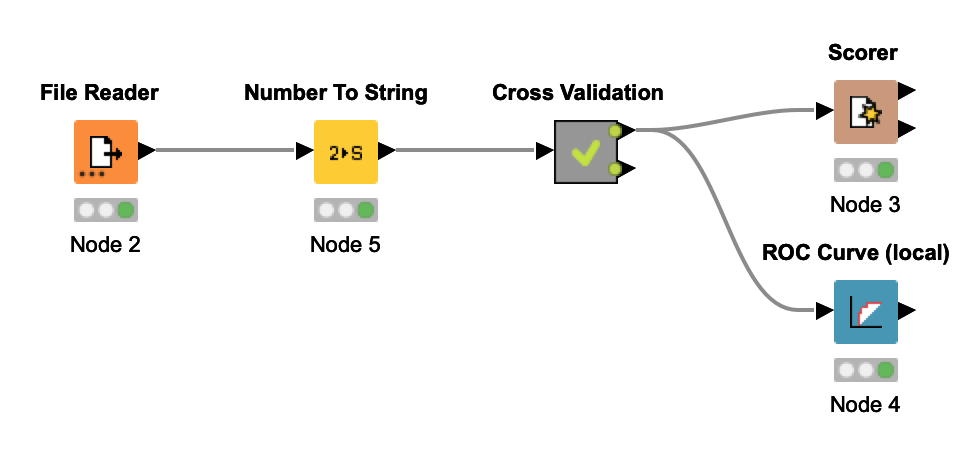
I am writing a section on software comparison and I wish to describe KNIME accurately, so I am turning to the community for help. I am a complete novice in KNIME. I wish to build the simplest k-fold cross-validation workflow possible with the tool.
Would this be a correct sequence of components for 10-fold cross-validation with random forest? The aim is to observe confusion matrix and ROC curve of the evaluation results.
Also, is it perhaps possible to observe misclassifications from the confusion matrix in a visualization? I.e. select misclassifications and see them exposed in the scatter plot?
Yes the sequence of node you used is correct. To observe misclassifications from the confusion matrix in a visualization you can use a component with two views. You need to use the Scorer (JavaScript) node though. Once you create your component with the two visualization nodes, i.e., Scorer (JavaScript) and Scatter Plot, you can select a cell from the confusion matrix and the corresponding entries should be highlighted on the scatter plot.
Please have a look at the example workflow attached.

 If the answer helped you, could you please mark it as a solution?