I started using the new Plotly Violin Plot Node and I am loving it so far. I just have one question is it possible to have two populations shown on the same X without combining them into one violin plot. In other words, can I have two separate violin plots shown and colored differently while on the same X. I thought if I used the color manager to color each of the two populations the node would make two different plots but it just combined the data into 1. I have it currently set up to where it makes two separate plots on two different X’s but it would be cooler to display them on the same.
This should be possible. In node configuration under Options there is Group-By column drop-down option. Define your grouping column and you will get multiple plots on same X
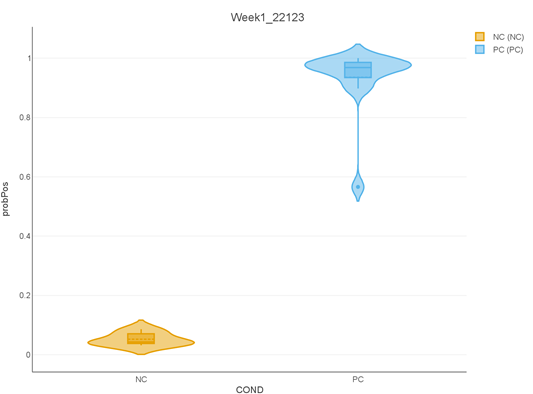
Thank you for the suggestion, however, it did not properly work. I checked your workflow and it has the same “problem” as mine (not a problem really its a feature). For example, using your workflow I want to display bad and good quality overlayed on one another not separated. I uploaded what my violin plot looks like, as its give a better sense of why I want them on the same X. The range slider is quite nice though and I will definitely implement that in my own workflow
ok. I understand now what are you trying to get but still not getting why you want it to overlap. What will you see with overlapping that you can’t see now?
I don’t think there is any additional insight gained from simply overlaying them its just I want to generate hundreds of these and in terms of space allocation its easier to visualize when they are the same X.
I see. What I can think of (besides R or Python that might have this possibility) is Generic JavaScript View node where you can write your own code cause as you figured out already this is not possible with Violin Plot (Plotly) node.