Visual Progress Bar for loops

Having a bit of “KNIME fun” as its the weekend, but hey it may be useful :slight_smile:

There have been a few mentions on the forum regarding loop progress indication, such as here:

This inspired me to see if something a little more “visual” could be achieved. I have used Node Annotator from the the Nodepit Power Nodes for this this so you need that extension installed if you want to try this out.

Ah… but we can only annotate nodes with TEXT, right ?

Well yes… that is true… but undeterred…

image

… the blue squares represent 1% and the green circles each represent 10% ;-). When everything goes green, it indicates completion at 100%

Here is a demo animation on Windows 10. On other OS it may appear differently so I’d be interested to know what it looks like.

loop-progress-bar


I have three components for different scenarios:

  • For when you have a loop that has both a currentIteration and maxIterations flow variable automatically created, e.g. Table Row to Variable Loop
  • For when you already know and configure the percentage progress value:
  • For when you know and configure the current value and target value:

Just through the brainstorming of @takbb :heart: , I was inspired to learn some usage of Annotator related nodes. This is the effect on Mac.

It’s a pity that the Node Annotator node does not support more svg. If it does, it will open up more possibilities.(I have suggested to Nodepit already)

To be honest, I think the canvas in the middle of KNIME should support more svg effects and editing, so that the canvas in the middle is directly a display area, and the view of various components is an unnecessary abstraction layer.

Try to imagine if KNIME has this effect: tldraw computer

5 Likes

This is brillant!

Thanks!

1 Like

Thanks for posting the video from Mac @HaveF . It displays with slightly less separation between the emoji, which gives a nice effect. Just need to see what Linux looks like now…

And interesting thoughts on the workflow canvas. It would be good to have ability to one day be able to “program” canvas effects.

I like the KNIME 2025 rocket annotation :slightly_smiling_face:. This all brings back fond memories of programming animations on early 8 bit micros!

Maybe I’ll look through the available emoji to see if I can make a “rocket flying from earth to the moon” progress bar :rofl:

Pinging @danielesser and @qqilihq … The guys behind the Powernodes… Maybe it would be possible to incorporate the progress bar idea into the power nodes, since you already have the node annotation sorted out? Would be a nice addition. :pray:

3 Likes

Great job on the progress bars and I definitely like that idea! Would you mind dropping us a line on mail@nodepit.com to see how we can bring this together? :slight_smile:

-Philipp

2 Likes

Thanks Philipp, @qqilihq, I’ll be in touch. :slightly_smiling_face:
Brian

1 Like

I absolutely love this annotation progress bar idea!!!

1 Like

What would be your optimal built-in solution here?

This is a unique use-case since the basic metaphor is that nodes only display a progress bar when they are actually executing – but in a loop execution, no single node is continuously executing.

You could think about wrapping all of that in a component but even then I don’t think progress based on the number of executed and total iterations would be reported properly in the component execution status.

I suppose you could have the component produce a view that is being updated.

Best,
Ben

Hi @BenjaminMoser , I had a think about this, and you are right that this possibly is a unique use case, because it isn’t adding anything in terms of doing anything to the data or making things work better.

It’s visual feedback from the workflow about how the workflow itself is progressing. In a sense it’s a bit like “breaking the fourth wall” in the theatre, where the cast member acknowledges that they have an audience and starts talking to them :wink:


My initial thought was that having the loop start or end nodes provide such feedback made sense, but whilst any loop can tell you how many iterations it has performed so far, not all loops know how many more they have to go.

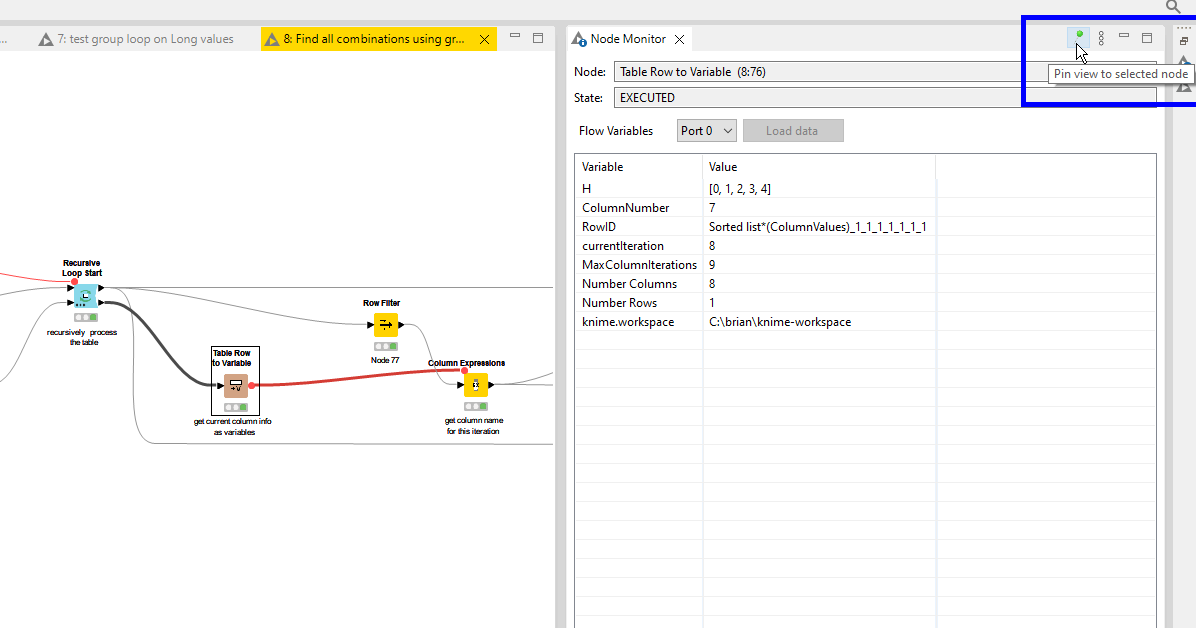
Table Row to Variable Loop Start, for example knows the currentIteration and the maxIterations so it could theoretically provide visual information at the beginning of each iteration about % completion, but many of the loop nodes do not have this prior knowledge and so it require a calculation to be done (assuming such information is even calculable).

I did look at components with some kind of visual feedback such as a bar chart, but they quickly become far too heavyweight and either the drawing of a small chart takes too long so it never displays, or its presence greatly slows the loop; the last thing you want when the whole point is that the loop is likely taking a while already, hence wanting to be able to continually observe progress.

The other thing about either monitoring a component or drawing a graphic is that on each iteration the component/node is reset and this might therefore cause a potential “refresh flicker” or worse,when what you really want is a continuous display.

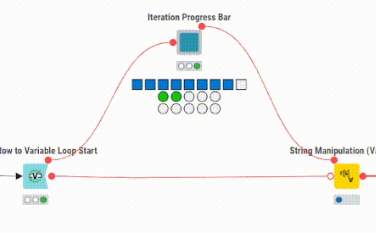
One feature of the Node Annotator is that changing the node’s annotation to provide the graphic (using some emojis that happen to look like graphics) is quite lightweight in its execution. The other feature that was useful here is that it has the option to not reset the caption even though the node has been reset. That was crucial to having it look relatively smooth in operation, like it was actually drawing the progress bar. If you turn that off, it resets on every iteration prior to drawing and the effect is not optimal!

So actually I think that even for a built in solution, I’d go for the option of placing a “progress/feedback” node on the workflow much as I’ve done with the component idea, and have it adjust it’s caption.

Given that we can see from Nodepit’s Node Annotator that the pieces are all avaliable without requiring new functional complexity, I don’t really feel the need for a complex alternative mechanism.

Using emoji for the graphic is a little clunky. It would be better if we could also change the font size of the node annotation in this situation to reduce the width whilst retaining the visual information.


  • I’d prefer this to be available as a node rather than a component simply because components remain “second class citizens” without there being a “component palette” within KNIME. The hub is good but it’s still a less efficient context switch to go grab a component than it is to use a node.

  • Sure, if we are blue sky thinking on this, then maybe a side panel in KNIME that gave progress bars for all loops might be nice but you’d still have to provide a way of configuring it for loops that didn’t know the “maxIterations”, and feels like overkill.

Although what is shown here is just the Visual Progress Bar for loops, in my opinion, it essentially demonstrates the probing function of the Node Annotator.

It is equivalent to the watch variable window in other programming language editors, allowing you to extract and monitor any key variables you care about in a component.

In other words, if KNIME could have a watch variable-like window to monitor variables, its functionality would be even more extensive.

Imagine having a window where, during the execution of the workflow, you could dynamically see the current values of the variables you want to observe.

image

1 Like

But variables are always the output of a node. So you couldn’t just have a list of variable watches, but it would be more like a list of node outputs. Which would essentially bring us back to the integrated port view.

In that regard we already have plans to make this more flexible and accessible, i.e. arranging panels freely etc.

For instance, in that direction, you could set up a “sticky” port view panel that stays open and always displays the port view of the configured node. This would come pretty close to your idea. What do you think about that?

Yep, that is on the roadmap :+1: .

1 Like

Similar in idea to the Node Monitor pane in Classic UI?

I used to use this extensively in Classic UI to monitor loops, by pinning it to either the loop start or a node near the start of the loop :slight_smile:

Hi, @BenjaminMoser :coffee:

I believe this is a good idea.

It’s fine for a single node, but I don’t know how to deal with the flow variable on a node in the component? Do I need to allow the flow variable to flow out of the component first and then observe it? If so, it may be a bit troublesome for the component.

Thanks for your input. As I said, our focus currently lies elsewhere (not sure I’m allowed to tell before we ship :wink: ) but improved panel management is on the roadmap. I marked down these ideas as reference.

Best,
Ben

1 Like

If you’re looking at integrating the loop progress bar issue from the platform side, it seems like the solution would be to approach it as an enhancement to the loop start nodes. Make the first execution process of each loop start bode be to calculate the total number of iterations and enable it to always pass that info downstream to the loop end node which then tracks the necessary current iteration count for the progress bar. That way simply connecting the flow variable output of the loop start to the flow variable input of the loop end could be a signal to automatically generate a progress bar either under the loop end node if done by annotation, or displayed as a popup / on menu menu with built in platform graphics.

1 Like

I believe you have an intuition about what to prioritize. :cake: :cake: :cake: