I can show you a Plotly solution, similar principles should apply to matplotlib/seaborn.
For the Plotly solution you will need to add the following packages to your Python (conda) environment:
plotly
python-kaleido
Kaleido is a package to export Plotly charts to static image file formats, and in this example is used to export the Plotly image to png.
The input to the Python View node is a KNIME table with the RowIDs set to the row labels and the column names set to the column labels. e.g.
RowID
One
Two
Three
Mon
12
33
44
Tue
55
66
12
Wed
25
64
54
The Python code is then as follows:
import plotly.express as px
import plotly.graph_objects as go
import plotly.io as pio
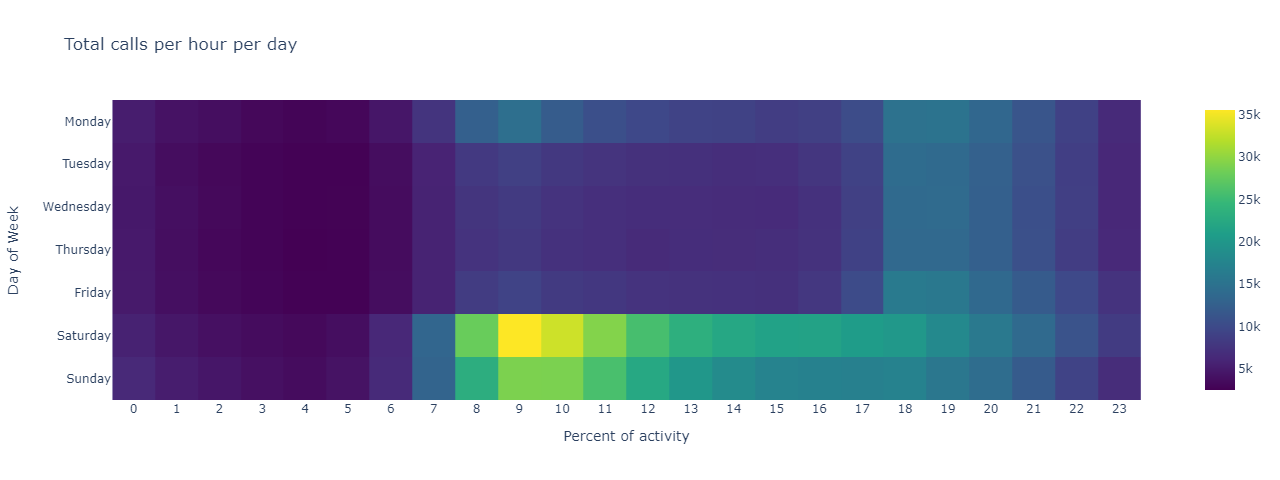
title = "Total calls per hour per day"
x_label = "Percent of activity"
y_label = "Day of Week"
width = 1280
height = 480
fig = px.imshow(
input_table,
labels = {
"x": x_label,
"y": y_label
},
title=title,
height=height,
width=width,
color_continuous_scale="viridis"
)
# Save image as to output
output_image = pio.to_image (fig, format='png', engine="kaleido")
The heatmap is generated using the Plotly express function imshow. This takes a pandas dataFrame as input (input_table) and displays it as a heatmap. The options should be self explanatory. The final line takes the Plotly figure and exports it back to KNIME as a png file for export on the image port (output_image). Plotly is highly customisable and there are plenty of resources on the internet to show how to adjust various features.
The above code was used to generate the following example output.
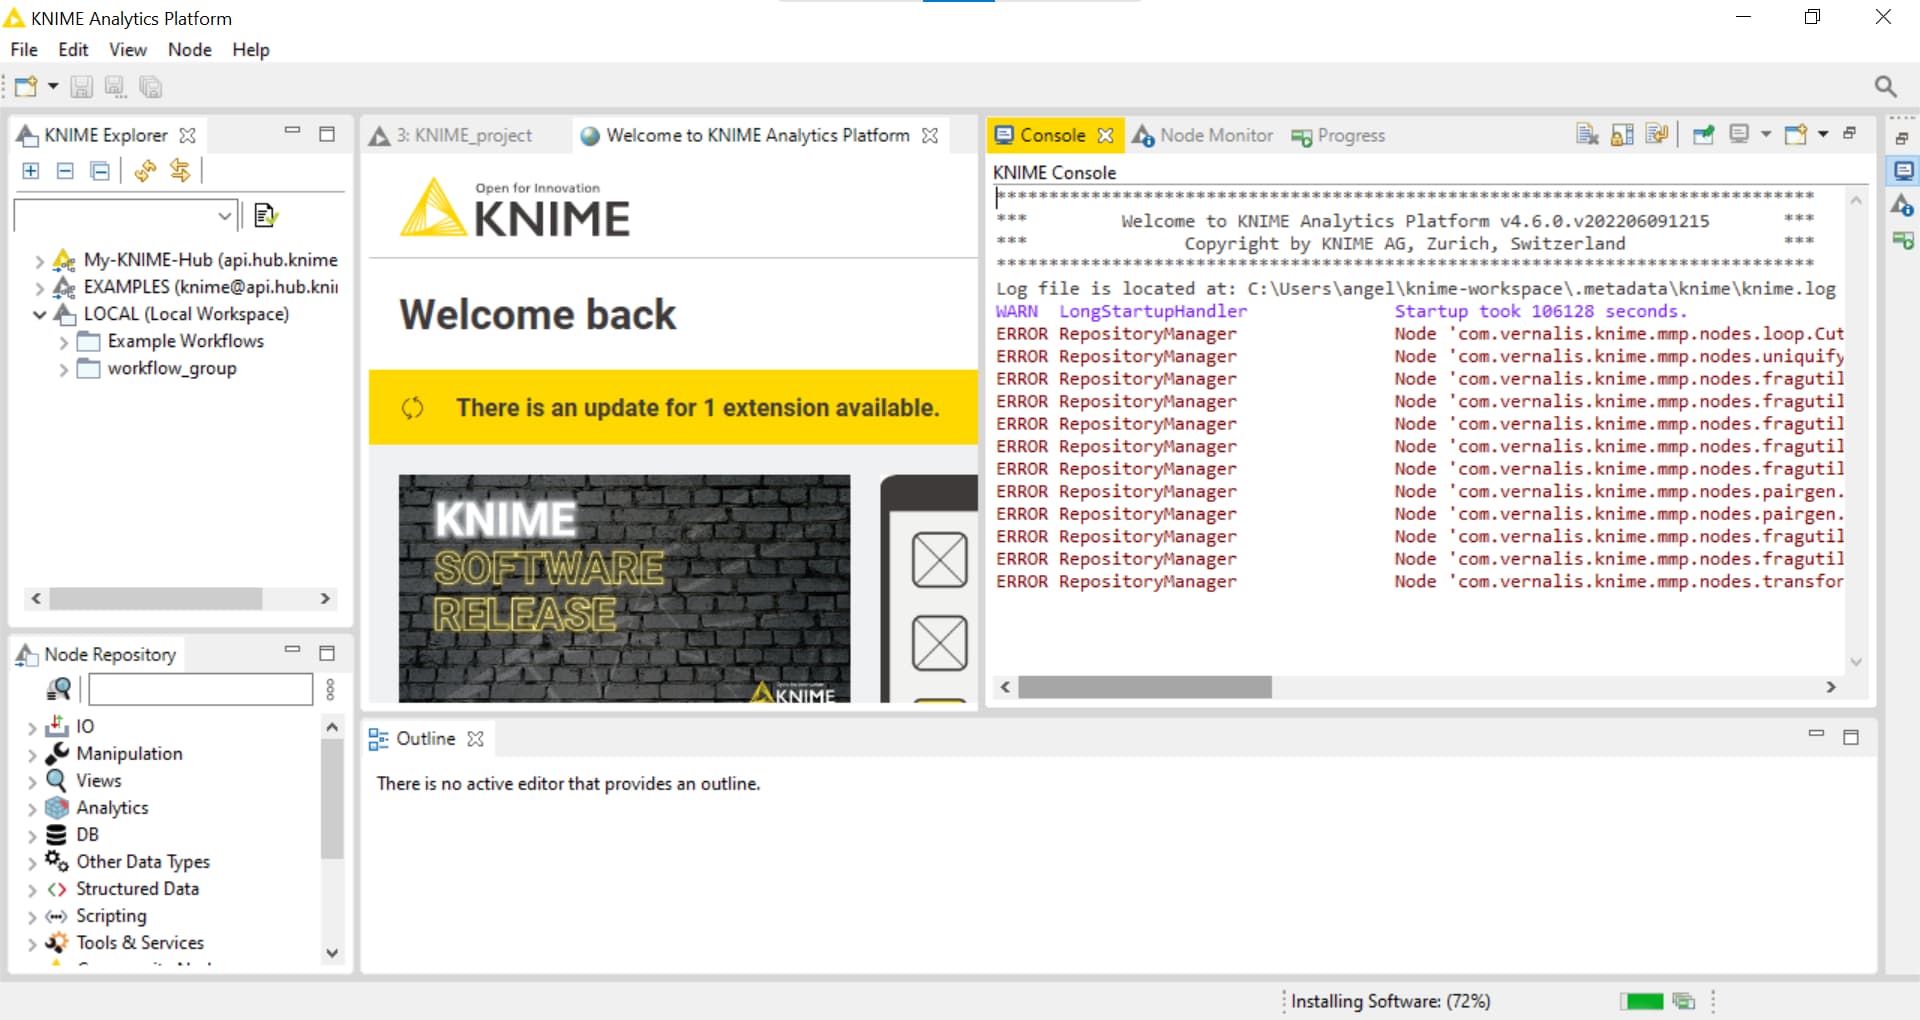
I am ashamed to say but I still can’t handle this procedure. I installed python node but i dont understand what i shold do next. Below is my screenshot
Hi @Angela_dru,
About the installation problems:
You seem to have the Python Integration installed in one of the screenshots above. What installation is not working now? Note that the " KNIME Python Integration (Labs)" node packages a Conda environment and the installation of this integration can take a bit longer. The errors in your last screenshot’s console have nothing to do with the Python integration but with the Vernalis nodes which is a community extension.
About plotting with the Python Integration:
You can use the Python View node with a script like this:
from io import BytesIO
import numpy as np
import seaborn as sns

uniform_data = np.random.rand(10, 12)
ax = sns.heatmap(uniform_data)

buffer = BytesIO()
ax.get_figure().savefig(buffer, format="svg")
output_image = buffer.getvalue()
Thank you very much for your explanation.
I already understood the process. I created successfully a new anaconda environment and already made some graphs.
Its not very complicate but for the first time I was frustrated.
Thanks for your feedback. We are working on making the process more seamless and less frustrating.
The “KNIME Python Integration (Labs)” already includes a Python installation → you don’t need to create the Python environment yourself if you don’t have special dependencies.
The “Python based KNIME Extensions” have an easy API to create views from plots (no need to write into a BytesIO buffer). Maybe something similar will come for the Python scripting nodes.