I am new to KNIME
I working with a dataset. Is there a way I can output different visualisations/charts images instead of saving each image separately. Each of these different charts/visualisations are based on different columns computed from the dataset .how can I save/export these to a folder , instead of saving each graph individually.
Basically when I run the workflow all these graphs/visualisations needs to be saved in a location. I can use them to prepare a report accordingly.
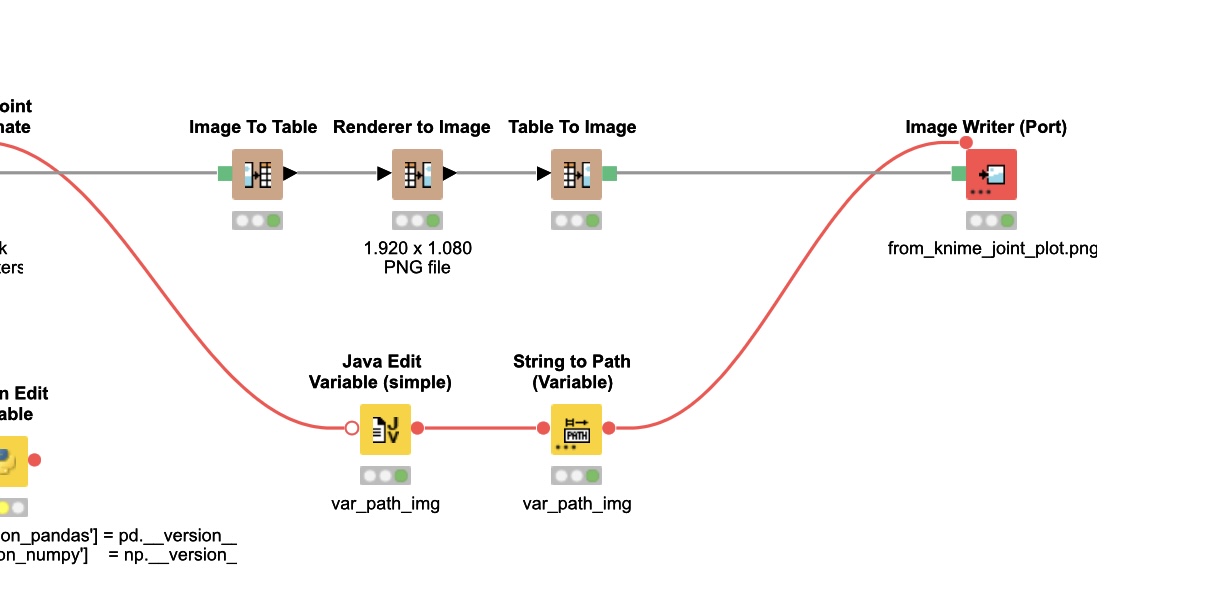
@praskavi welcome to the KNIME forum. You could use a loop and flow variables to construct the image names and save them to a folder like in this example. Sometimes you will have to activate the green image output in the settings of an image node:
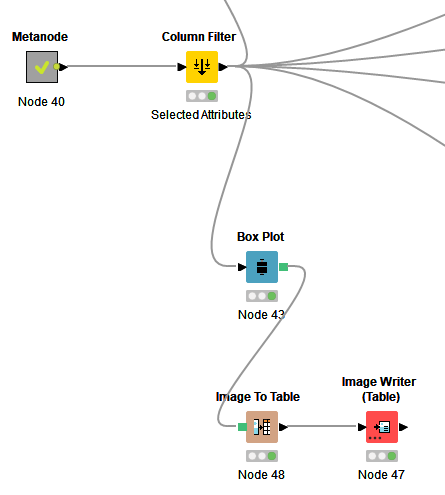
Thanks for your reply, PFA picture, I am trying to generate box plot ( eg: for 5 numerical columns),
I want to loop 5 times , save to table( Image to Table), write it to folder ( Image writer),
How can I loop ?