Dear all,
just as a info…
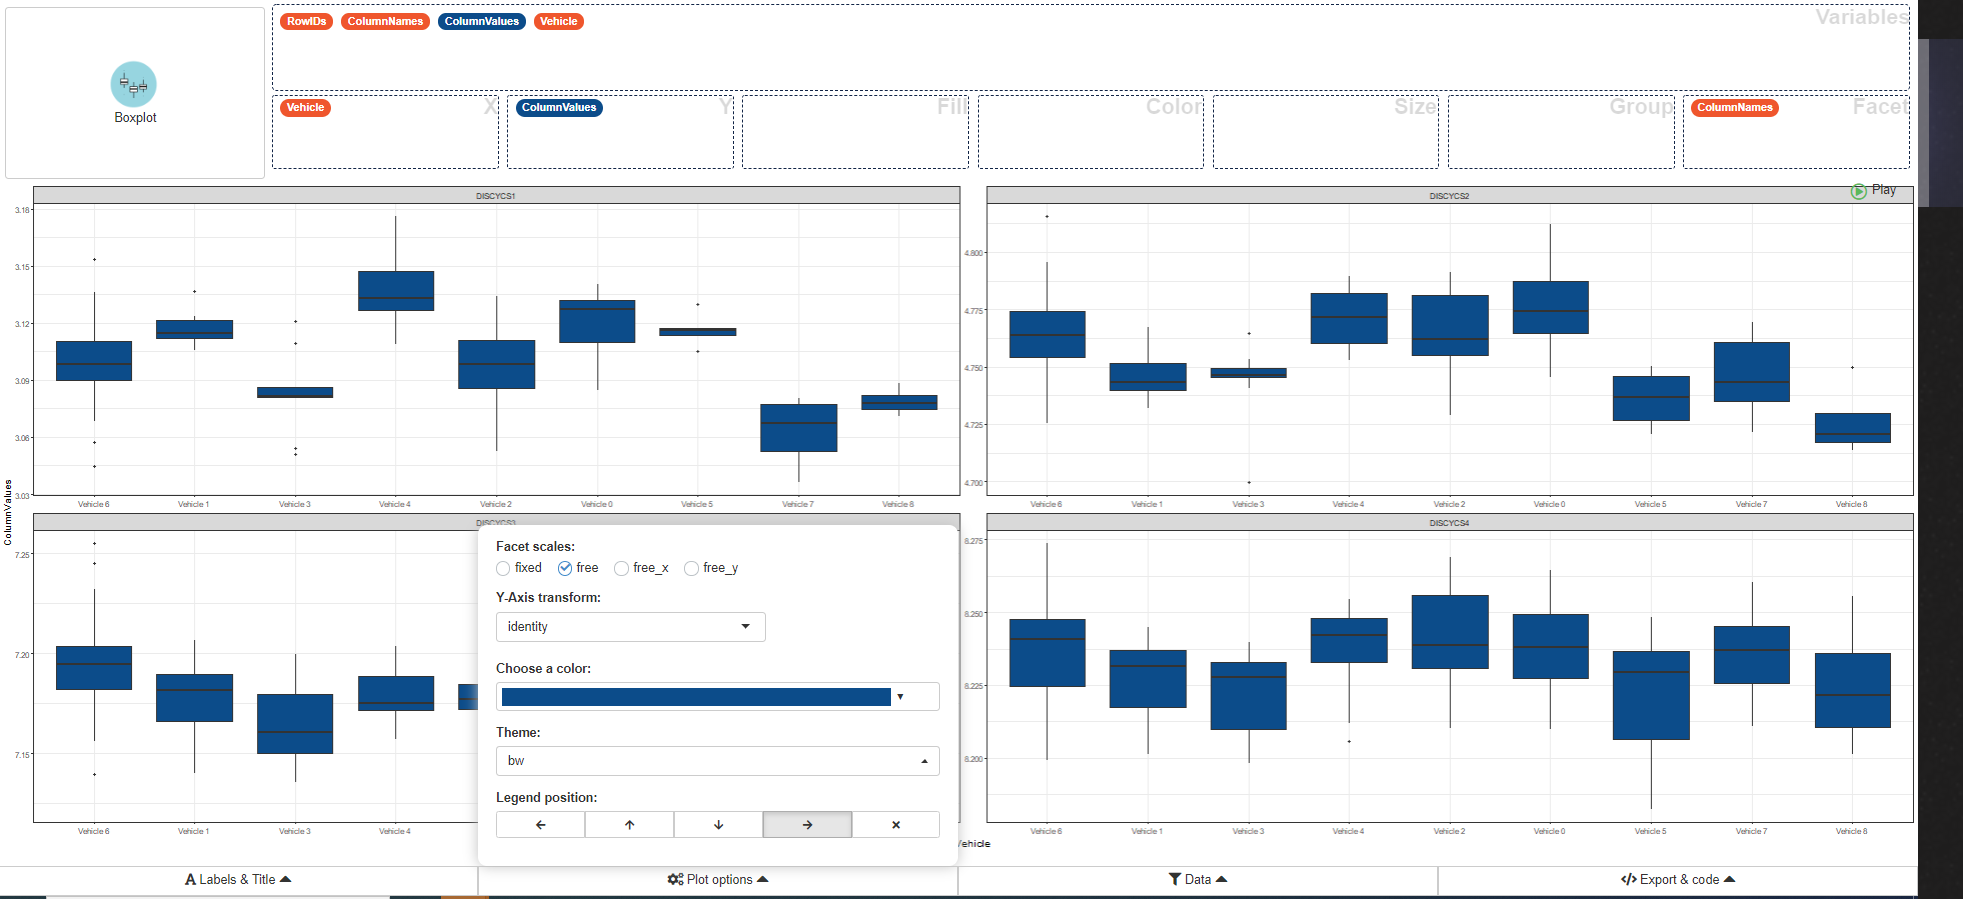
I just found the R package “esquisse” which provides an interactive way to create ggplot graphs. The attached file shows a screenshot of a browser window with the interactive interface.
Why I am still looking for something outside KNIME?.The plotly integration have greatly improved visualizations… but I am still missing some types graph (like a “simple” boxplot).
How to use the package “esquisse”?
You have to install it using the R installation KNIME is using. In my case it is not the pre-installed version KNIME is using as a standard.
Within the R node you just include
library (esquisse)
esquisse::esquisser(data=knime.in)
I am not an experienced R programmer, so there might be more help for you from others in this community.
Perhaps some basic hints for the use of R in KNIME.
I am using R independently of KNIME therefore I do not use the R installation delivered by KNIME.
Having your own R installation you should change in KNIME (Preferences… KNIME… R) the path to your new installation.
As IDE RStudio is very common, has a graphical user interface and is really good. I develop my small R snippets there and copy paste the code into the R Node.
RStudio is as well best suited to install additional packages, which are needed to create something like the graph posted.
I have learned R as I wanted to create Web-based visualization. So, I have never learned it seriously but by googling.
A good set of additional packages are collected in ‚tidyverse‘. The author of this package is Hadley Wickham, one of very prominent developers. So… up to you to google. He has also published some books for learning R. One on-line resource is https://r4ds.had.co.nz/index.html.
Have fun using R in KNIME! Both programs are my favorites…
@Haystack
The book @Juergen mentions is a great book. It’s build on/around the package tidyverse (which is really in essence a cluster of other very useful packages).
For timeseries analysis I found some time ago https://otexts.com/fpp3/ by Hyndman and Athanasopoulos. Great examples and also the theory behind it if you want more background on it.
I have put some examples of R usage with KNIME on the hub. They deal mostly with small tasks where I could not find an instant KNIME solution and they explore special tasks where there is a specific R package that solves the problem.