"vlookup" return interpolated values if no exact match?

Hi, I’ve searched the forum and don’t see anything addressing my issue.

I have 2 tables. I wish to “vlookup” using a value from table 1 to return a value from table 2. I have successfully achieved this using the “Value lookup” node.

The problem is that the value must be an exact match otherwise nothing is returned. If the value is not exactly matched, I need it to return an interpolated value from the breakpoints either side. Can this be done?

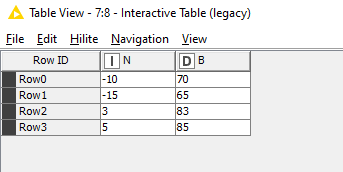
Example, I want to Lookup value in column A, to return the value in column B… but value is -15 (not exact match), I would need it to return “65” from column B (as value is half way between -10 and -20, it would need to return value half way between values 60 and 70.)

Table
A B
-20 60
-10 70
0 80
10 90

I hope I am clear, thank you in advance.

That is not a “value lookup”. That requires a mathematical calculation. I would start by using the Lag Node to create a new column so that all of the data for the calc is on the same row.

Hi @b_mitchell , I think a couple of value lookups, a joiner and a math formula can do it, if my understanding is correct

image

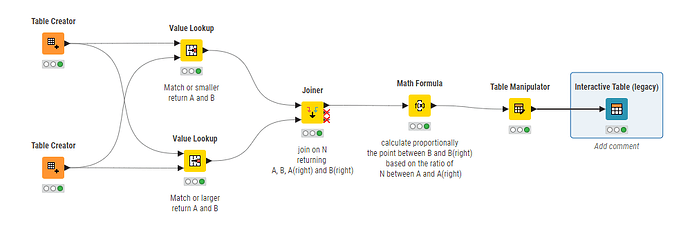
Value lookup can be set to return “exact or larger”, or “exact or smaller”, so do it both ways and then for each value of N you have A and B in both directions from N, if N doesn’t exactly match A. Join together the results, and you then have the following table:

After this, you can do a math formula which finds the point between B and B(right) which is proportional to the point where N lies between A and A(right)

(assuming my calc is correct, but if not, I think all the pieces are here so just need to fix it, and I need more coffee :wink: )

( $N$ / ($A$ + $A(right)$ ) ) * ( $B(right)$ -$B$ ) + $B$

proportional vlookup.knwf (84.4 KB)

[edit: if it is possible for N to be “off the scale” you will have to determine what you want to occur in that situation]

2 Likes

Thank you so much takbb. Exactly what I needed! :heart_eyes:

I’ll try implement this into my workspace today! Good work!

Unfortunately my workflow is going to end up have a great number of these, it would be great if this could be implemented into a node, is there a way to request features?

Hi @b_mitchell , thanks for the kind feedback. Unfortunately I did discover a flaw in the calculation.

I believe it fails if the “A” range crosses the zero boundary, if there isn’t an explicit value of zero in the A column, since it tries to find 0 as a ratio of the range which will alway returns 0. Also if 0 is in the A column, and we select it we have a division by zero in the calculations. :frowning:

Zero - it’s nothing… but trouble! :wink:

So, I’ve looked to handle this by first adjusting the A-range when it is returned, so that if the low-A value is below zero, the range and the value of N used in the calculations is adjusted upwards.

With regards to your question about feature requests, there is a “Feedback & Ideas” section of the forum where you can suggest features, although of course there is no guarantee of implementation.

One of the nice things about KNIME though is that even if a node doesn’t exist, provided you can make something sufficiently generic that it could be reusable, it is possible to package up a sequence of nodes as a component. So I’ve looked at doing that here:

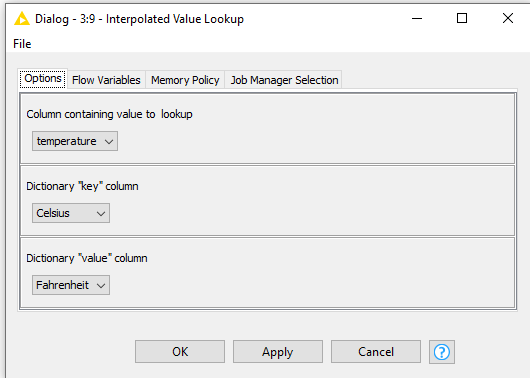
The idea is that you configure it with just three options. The column to be looked up (N in your example) and the two “dictionary” columns (A and B in your example). It then attempts to return the required result interpolating B based on the position of N within A.

I’ve attached my sample workflow, where as I test I thought that this would actually make a generic “converter”.

image

Simply by giving it a value range for Celsius to Fahrenheit conversion as follows:
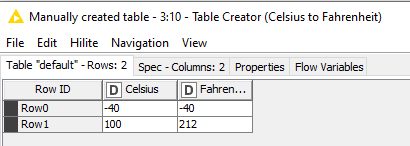
image

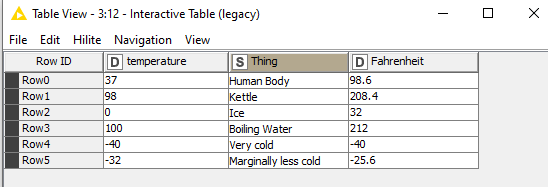
It is possible to supply it with a set of “things” within that range that I wish to convert:
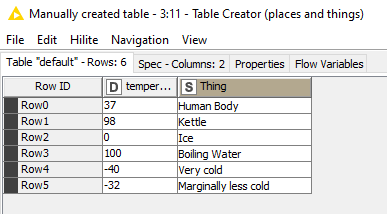
image

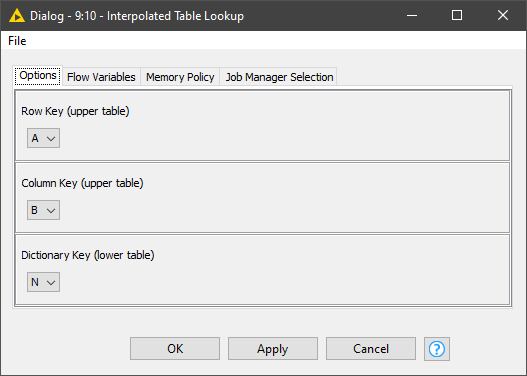
Configuring as follows:
image

Out pops the conversion :slight_smile:

image

Back to your question at hand. You can drop the component from the hub onto your workflow and then you should be able to copy/paste it wherever you need to reuse it.
Interpolated Value Lookup.knwf (35.6 KB)
1 Like

First of all, thank you for your continued support! This is fantastic.

I tried to use the Interpolated lookup node in my workflow and it did not work, after playing around for a few minutes it became apparent that duplicate values in the source data (“temperature” in the example above) stops the node from working :frowning: Is this a simple fix?

I’ve illustrated this is the workflow attached,
Interpolated Value Lookup_Test.knwf (37.3 KB)

On another note, I’m modelling a software where if the value is out of the range of the dictionary lookup table then it takes the minimum value (if below range) or max value (if above). Is this something that could be built into the node?

Again, thank you for going above an beyond in this matter and helping a relative newbie to KNIME. The community surrounding this program is incredible!

1 Like

Hi @b_mitchell , I’m glad that it is (kind of) working :slight_smile:

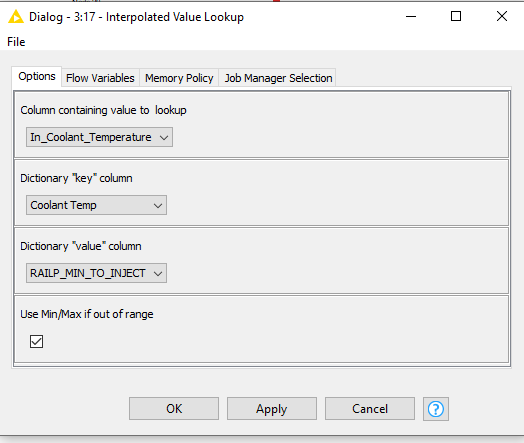
Yes the duplicates problem was a simple fix, and an oversight on my part. I’ve also addressed the second part (out of range) by adding a further option on the config

image

If you make sure that is ticked (it should default to ticked), then it will use the max or min as appropriate when out of range.

I’ve updated the component on the hub. With KNIME 5, I think you currently have to close and reopen the workflow for it to check for updates, or else switch to Classic UI and then right-click it and select Component - Update Link. Failing that, just drag it off the hub again :wink:

1 Like

I can’t thank you enough for putting that together! Works perfectly!

This is a node I will be using a lot, how do I add it to new workflows? Is there a way to add it to the Node Repository for quick access?

Hi @b_mitchell,
Good to hear it is working for you and thank you for confirming it as the solution.

Unfortunately there is no ability to add components to the node repository or any kind of quick-lookup panel - a feature I would really like to see in KNIME, as currently components feel a little like “second class citizens” compared with nodes.

What you can do (and I do this for some) is copy and paste the component into a dedicated “components workflow” you create with a name such as “_components”. By putting the _ at the beginning, it will keep it near the top of the list of workflows. Then you could just copy and paste it from there whenever you need it. An alternative is to bookmark specific component hub pages in your browser for relatively fast access.

1 Like

Good Idea, will do! :star_struck:

Hi again, I feel like i’m bothering you now :stuck_out_tongue:

I was wondering if this could be adapted to lookup values from a table, still with interpolation…?

for example, lookup “x” and “y” to return “z”, interpolating in the case that you are between values…

x y
15 3
20 5
35 7
x/y 2 4 6 8
10 35 40 45 50
20 40 45 50 55
30 45 50 55 60
40 50 55 60 65

I’ve been looking at your workflow from the above and can’t quite get my head around how to implement that? I get the impression it’s significantly more steps than just looking up x to return y!

HI @b_mitchell , yes that would certainly need some new ideas, lol

What would the expected result be for each of the x and y values you’ve given, and how would “between” be expressed mathematically, given that the result is now potentially “between values” in 2 dimensions instead of just 1?

I’m assuming that for this to make sense, the lookup values would always increase as they go downwards or to the right in the table?

Right, I’ve managed the maths in excel. I hope this explains itself well enough!

xyz lookup with interpolation.xlsx (13.0 KB)

Does this seem feasible?

1 Like

Thanks, that I think confirms my thoughts on it. I have a plan… :wink:

This consists of two parts. The first part is a new component that extracts a table which is then used as the lookup table in the existing component.

e.g
Given your table:

x/y 2 4 6 8
10 35 40 45 50
20 40 45 50 55
30 45 50 55 60
40 50 55 60 65

presented with “x=15” the first component fetches the lookup table for x=15 based on the values “either side or equal to x”

x 2 4 6 8
10 35 40 45 50
20 40 45 50 55

This table is then recalculated into a single row using the interpolation formula for where 15 is located between 10 and 20, being applied to each of the returned “y” values.

Resulting in a table such as this:

x 2 4 6 8
15 37.5 42.5 47.5 52.5

This table can then be transposed to form a new lookup table:

N V
2 37.5
4 42.5
6 47.5
8 52.5

and is then the subject of a lookup of the Y value (3 in your example) using the existing component…

which would hopefully return the correct point between 37.5 and 42.5, which is 40 as confirmed by your spreadsheet.

Well, that’s the plan. That feels quite doable. Once this second “Interpolated TABLE lookup” component is built , it and the existing “Interpolated VALUE Lookup” component could be packaged inside a third “wrapper” component … hopefully I’ll have some time later to build it, but if anybody else wishes to take up the challenge in the meantime, feel free :wink:

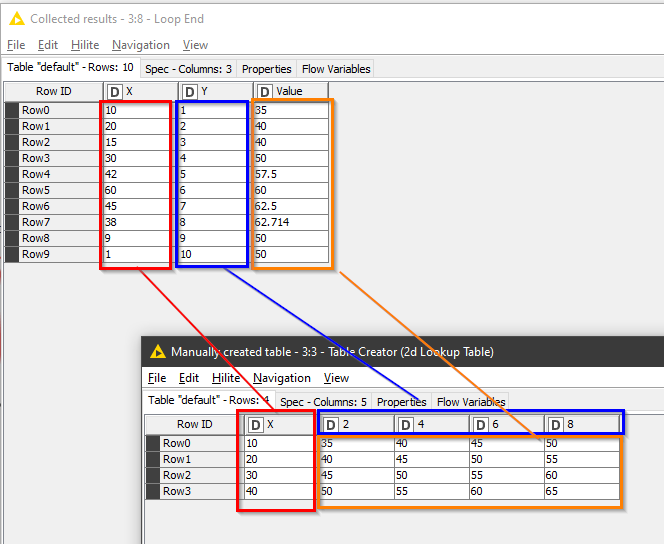
EDIT: @b_mitchell , I have a prototype built. Currently I’m combining two components. Perhaps you could give your thoughts to the following test data. It looks right to me, but would be useful if you could check it too.

X Y Value
10.0 1.0 35.0
20.0 2.0 40.0
15.0 3.0 40.0
30.0 4.0 50.0
42.0 5.0 57.5
60.0 6.0 60.0
45.0 7.0 62.5
38.0 8.0 62.714
9.0 9.0 50.0
1.0 10.0 50.0

2 Likes

As far as I can tell it looks spot on! You work quickly!

I’ve been attempting to do it myself for the last hour or so, wasn’t getting very far…

It’s very useful to me while I’m learning to see how you solve the problems I am having, so thank you… again!

HI @b_mitchell
take a look at this demo workflow

I have added two new components to the hub (so now three “interpolated lookup” components in total)

The above demo workflow uses this “Interpolated Table Lookup” component to loop through an input table and for each row, find the results in the supplied lookup table:

This new “lookup” component does pretty much what I described earlier. It is a wrapper for this new component, which extracts and interpolates a one-dimensional lookup table from a 2d lookup table:

and of course then uses the original “Interpolated Value Lookup” component to pull the desired result from it:

Right now, the “wrapper” component has little in the way of optimisation as it loops through the input table. If you have a relatively small number of rows, then this shouldn’t be a problem, but if your input table is many thousands of rows, then this could run into minutes of processing. If that is a problem, I’ll try to think of some optimisations to reduce the number of total iterations required, but for now, hopefully it will work!

2 Likes

Very creative @takbb

I have to admit that there is no way that I would have thought to attempt this with the Value Lookup node. I guess when you select “If no row matches: Match next Smaller” (or larger) then it basically finds a <= or >= match to the criteria in numerical datatypes? Do you see an advantage of this approach vs using a formula based approach such as the dictionary rule engine to apply the changes?

1 Like

Good question @iCFO:slight_smile: I haven’t tried attempting the above with the Rule Engine (dictionary), so cannot categorically say one way or the other. “Reading between the lines” in my answer you may be forgiven for thinking that actually the idea never occurred to me. :rofl:

The only thing I’d say (after having done it) is that, now that it exists as a component, its nice that it works ( subject to the usual smallprint :wink: ) without having to define any rules. You just need the value and the lookup table, which to me is a plus. And of course the major effort was in fulfilling the “interpolated results” part of the request so not only is the key not necessarily found in the lookup table, but having not found the key, we can return a value that we couldn’t find either, lol.

1 Like

Hi takbb,

I’ve downloaded the example workflow, I believe configuring the node correctly…

image

The output table is not showing the correct results… I’m trying to understand why!

A B Correct Knime Output
10 1 35 50
20 2 40 55
15 3 40 52.5
30 4 50 60
42 5 57.5 65
60 6 60 65
45 7 62.5 65
38 8 62.71429 62.71428571
9 9 50 50
1 10 50 35

I used the excel sheet I attached in an earlier comment to calculate the “correct” value and it does not match :frowning:

The “20,2” point, that’s an exact match in the dictionary table and should return 40!

Strangley the values you had in the post above were correct

Any ideas?

Hmm… looks like something broke after I did the screenshot. It was definitely working at one point! Will look into it and post an update.