I’d like to ask your advice in the following: I have two excel tables. I want to VLOOKUP these 2 tables and keep at the end only data which are do not repeated between 2 tables.
I tried to use Table difference finder, but system always shows data, which are repeated. What I do wrong using this node?
Are you able upload the workflow you’ve done so far, with some sample data sets and tell us what you want the required result to be? Then people can give ideas on what you might have wrong, or if there are better ways to do it.
For example, the solution might involve concatenating your results/data sets and find then using duplicate row finder to find only “unique”, or it might be to use the Joiner (Labs) node and pull out only the outer joins (mismatches) but not the inner… or potentially many other solutions, but without example data it’s difficult to say what is best for your specific issue.
thanks and best regards.
Hi @meTan , thanks. I and I’m sure others will take a look.
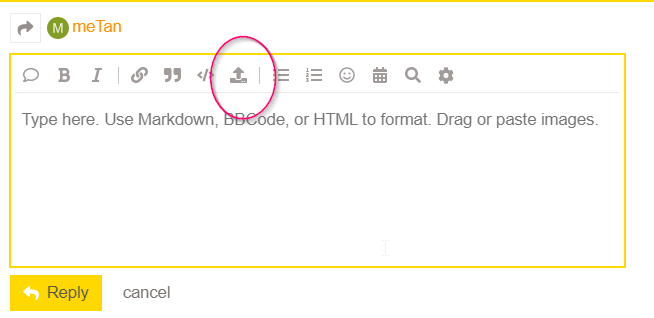
Re your question about storage in Knime Portal, here on the forum when posting or replying to a message you can upload files (such as your sample workflow) by clicking the “Upload” button here:
That’s the best way to upload workflows with your specific question.
If you have csv or other files that you wish to share along with your workflow, make sure they are in the “data” subfolder beneath your workflow’s folder.
If you have a workflow that you feel may be useful to others as a more general example, you can share it to your public hub space, from within KNIME AP by right-clicking on your workflow in KNIME Explorer, and selecting “Deploy”, then choosing “Public”. You will need to have your KNIME logged into the hub for this option to be available (double-click under KNIME hub in KNIME Explorer if you haven’t already done so)
@meTan ok I just opened your workflow, but as you said, you don’t have the data files with it.
It is best to locate them within your workflow’s data folder and then reference that “locally” within the Excel Reader nodes.
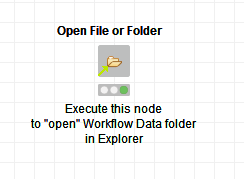
To “simplify” this, I have dropped a component of mine on your workflow and uploaded it here. Open the attached workflow and save it locally using the SaveAs button that will appear on the yellow “temporary copy” bar. Then execute this node (my component)
That should open Windows explorer (if you are on Windows!) at your workflow’s data folder
Drag and Drop your two Excel files (All Data.xlsx and QA approved list.xlsx) - don’t rename them - into that data folder, NB You will be overwriting the two dummy files that I have already placed there.
Then re-export this new workflow and upload it here. It will then contain the data files (and hopefully references to them) in the workflow.
These components are just something I use for convenience, and you can of course do this all manually with your existing workflow, if you know where the data folder is, but it was going to take me too much explaining!
lol… @ipazin… oh I vary between curved and not curved going where my mood takes me… but that said, I think it’s going to take far more than curved lines to make my flows look in any way “nice”
Re the component. I now use it on my workflows all the time. It serves two functions, it can open the folder (or file) if the “enabled” button is ticked, and additionally it automatically creates a Path, String and URL variable to work with any of the File nodes, new or old. I just find that more convenient, and I don’t have to care what the nodes require. It can also be attached at the end of a flow, via the flow var port to auto-open a generated file at the end.
Hi @meTan, the attached flow has two ways that I’ve thought of. The first is more involved than the second, but both result in a list of users who are in the “All Users” list but not in the “Approved” list which is what you said you wanted earlier. I suggest using the nodes I marked as “Option 2” as it is a shorter solution. The Table difference finder node isn’t suitable as it is performing comparisons based on rowid matching too, rather than just looking to see if one set contains the other.
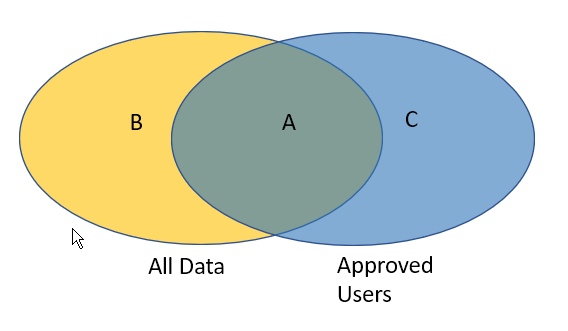
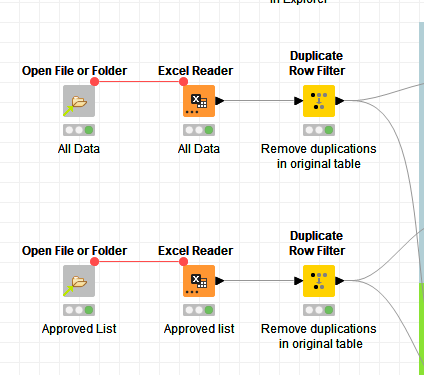
My understanding is that you have two sets of data as pictured in the following:
What you are ultimately wanting is the items in “All Data” that are in the yellow region B.
First off, your data sets already contain duplicates so these get de-duplicated before we go any further:
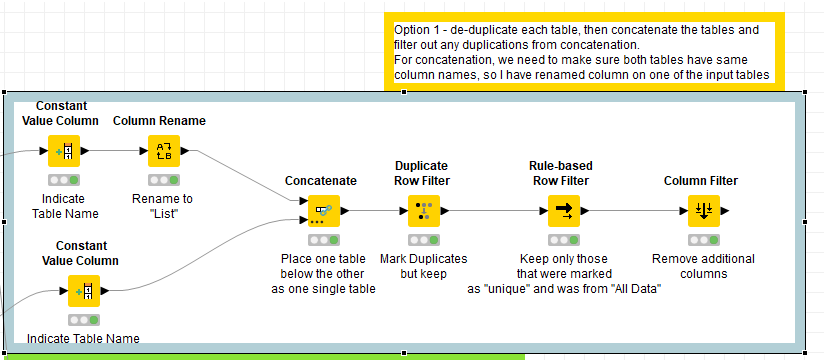
After this you can find a unique set from All Data (regions B+A), and union those (concatenate) with a unique set from Approved Users (C+A). Any duplicates that you now have are by definition in region A (i.e. in both), so these can be discarded. If we make a note of whether each remaining row was originally from All Data or Approved Users, we can select just those that are in All Data and this gives us region B. This is what Option 1 does.
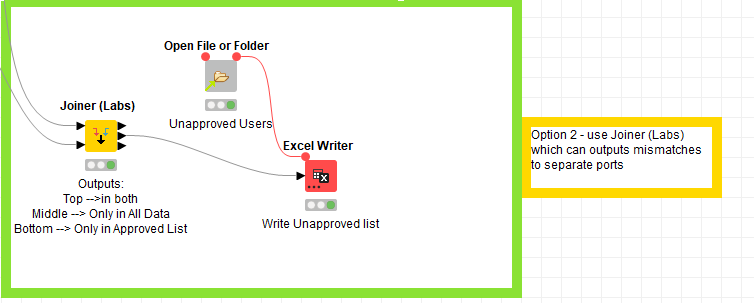
Alternatively, option 2 makes use of a feature of the Joiner (Labs) node. This has the ability to join two data sets All Data and Approved Users and output the items from each of the regions A, B and C into the output ports Top, Middle, Bottom respectively. So this gives you the output that you require on the middle output port. For demo I’ve included in this option the writing to an output excel sheet.
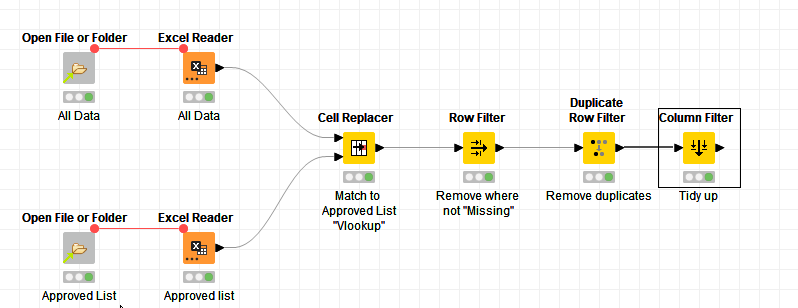
Over a cup of coffee, I realised that it would be remiss of me not to include a third option using Cell Replacer.
This is because:
(1) Cell Replacer is really a direct analogy to Excel’s VLOOKUP, and you did mention that in the title, so I should have thought to use it sooner!
(2) If I don’t, @ipazin will think I’ve been ignoring his past suggestions…
So here, for each row in All Data, it uses cell replacer to lookup (like vlookup) that value in Approved List, and if it finds it, it puts the value from Approved List into a new “Approved” column. It then keeps only those marked as missing (not found in approved list), returns it as a “de-duplicated list” and tidies up.


 But I do see more curved lines