I built a regression model and the R squared is 0.48.
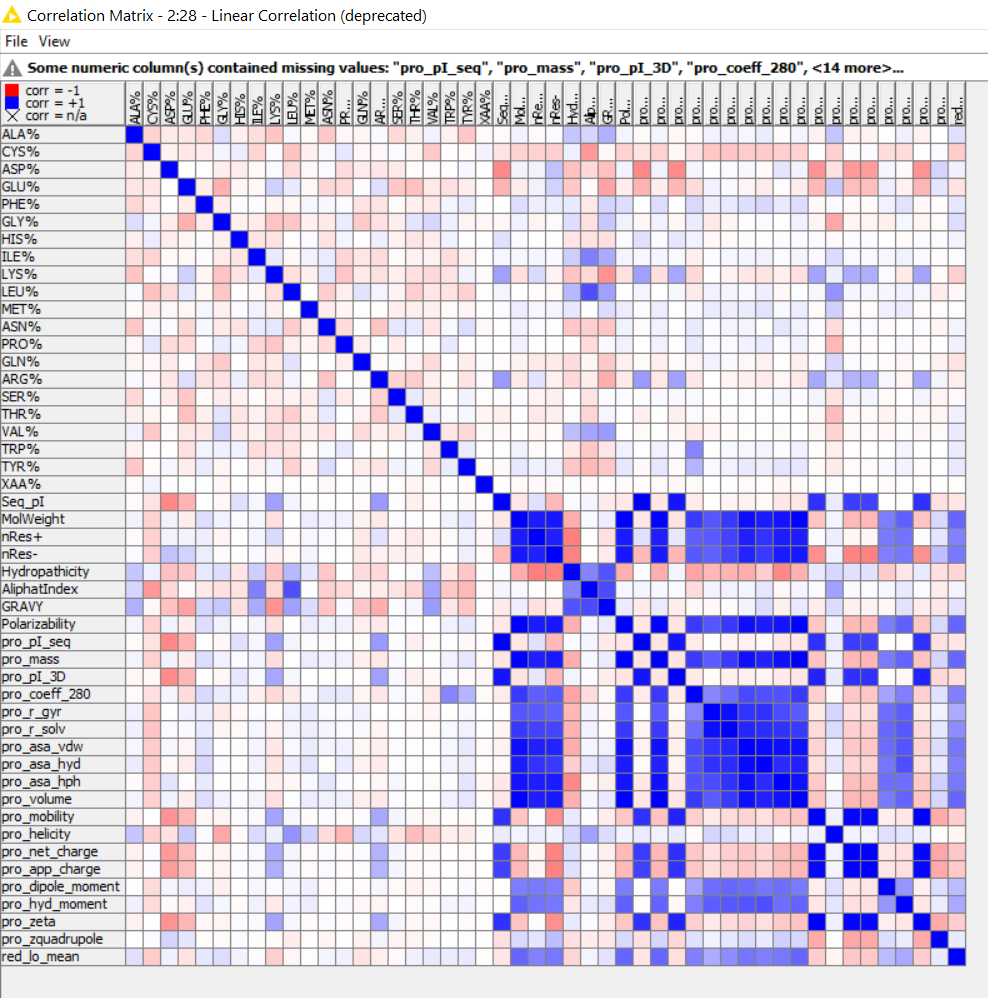
I put below a correlation matrix where the last row is the dependant variable.
What should I tune to improve my model?
Hi,
what model are you building exactly? Is it a simple linear regression model? The features that are highly correlated with your dependent variable (blue boxes in the last column) are of course very useful. Have you tried training a model only on those?
Kind regards,
Alexander
I am trying to build a regression model from my dataset. I tried almost all the techniques available in Knine such as simple linear regression, random forests, logistic regression, XGboost tree, polynomial regression…
When I apply cross-validation, linear regression gives output:
jjj.xlsx (11.3 KB)
It works with random forests and H2O Gradient Boosting. Initially the R2 doesn’t not exceed 0.43
Then, I removed one of independant variable Xa and I applied the following math modification to the dependant variable Y:
-log(Y/(Xa)2).
I also removed some samples with extreme Y. I have to note that this variable Xa is correlated to some of the other independant variables.
Miraculously, R2 for random forests jumped to 0.75. If I apply PCA for the independant variables and cross-validation, R2 is almost 0.99 which is too good to be true.
This big jump from very bad to very good is quiet worrying.
Are there some tests like p-value (I am not sure how to extract it in Knime) that let me trust the model and its R2?
Thanks,
This topic was automatically closed 182 days after the last reply. New replies are no longer allowed.