Hello,
I am getting a good R2=0.801 on the training. But it is R2 on the test is almost 0.
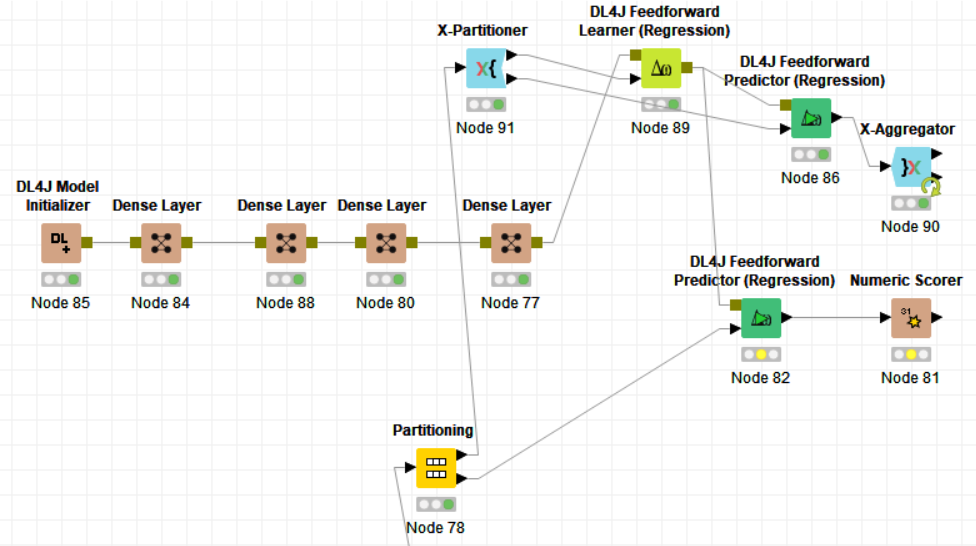
I think I am doing something wrong in the model that I used from the cross-validation.
It seems that I am taking the trained model from the last fold of the cross-validation only.
Can anywone spot my mistake?
Hi @zizoo. The purpose of cross-validation is to asses the quality of the model. You should retrain the chosen model with all your data in order to put it into production. You are right: if you pick the trained model by the end of the cross validation you’d be using the last trained one.
Hi @iperez .
How can I assess the quality of the model with cross-validation (when can I say it is a good model?)
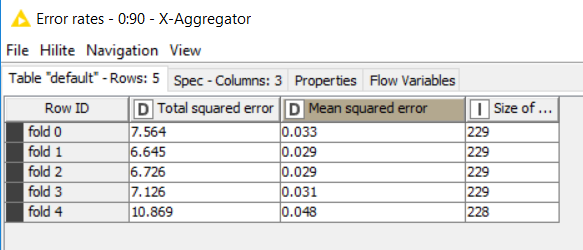
Here the metrics from the crosss-validation:
It looks very poor for prediction as you can see but the train model gives about R2=0.9.
Is there a way to improve the prediction?
HI @zizoo. The idea of Cross Validation is to have a better insight by training(testing with a variety of data. With the results of every fold you can get a better idea using an “average” of your performance measures, for instance your MSE should be around 0.034. You can check how the R^2 is in the different folds. Improving the prediction is a harder question, depends on the model, data purpose…
Hi @iperez
I am trying to solve this problem for three years now in Knime.
I still don’t get it to make the prediction publishable.
As it is now R2 almost zero, this means all the work is useless.
Is it possible to share with you the data and the workflow ?
Hi. Sure, if you post a sample of your anonymized data and what you’re aiming at I’m sure you’ll get plenty of suggestions. Just curiosity: when you say that you have R^2=0.9 do you mean 90% or 0.9%?
Hi @iperez
I attach below the workflow with the anonymized data. The first column is the target.
I did normlization for all features but the target.
I tried with feedforward DL4j and with random forest
As you can see, the R2 from the training in both cases is 90%.
When I use the model on the test, I get R2= 40% and below zero for DL4j.
M14.1.knwf (1.7 MB)
What was the ensemble performance?
Have you tried any preprocessing steps?
Hi @Daniel_Weikert ,
I tried to remove autocorrelated features, and to use PCA and t-SNE, normalization, but this did not help. The training gives a high R2 but the moment I bring an external dataset, the performance collapes.
It doesn`t make much sense to look at the training R^2, looks that both of your models are overfitting.
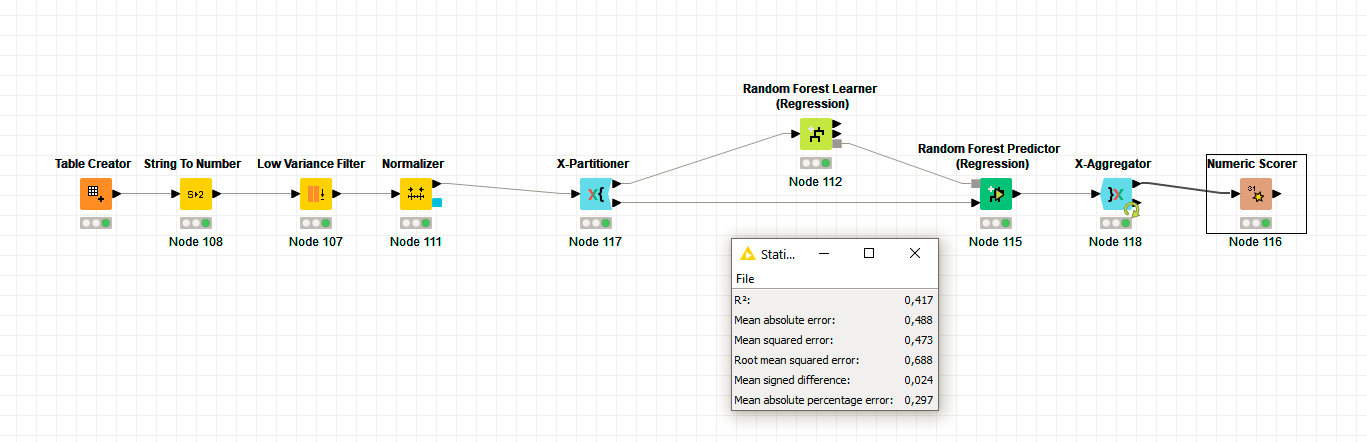
Cross Validation with the Random Forest gives an expected R^2 of 41%:
I tried to remove correlated feteaures like you suggestred but it doesn’t change.
Maybe some more careful selection of attributes using for instance:
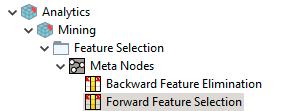 might help.
Trying to define additional derived variables from the final attributes selected might also be worth exploring
I tried to do the forward feature selection. R2 increased from 43% to 50%
I also tried to do hyperparameters tuning but R2 did not improve further.
Do you think this is the best I can get and I have to throw the data or there is anything else to make the model publishable.
Thanks
I have to be a bit harsh. I hope you don’t take it personal. it’s meant to be educational. But just because KNIME makes it easy to play with ML/AI doesn’t mean it’s easy to do it right. I speak from experience BTW.
Your example workflow has a major flaw. Of course you get good metrics if you use the exact same data you trained the model with. This will always be much better than on your test data. That is exactly why we split into train/test and only ever evaluate on test.
In regards to the image in your first post, instead of taking one model out of cross-validation loop to apply the test set, make a model with all the data from the training set after cross-validation. Ask yourself why are you doing Cross-validation exactly?
And I can’t let the next point slide as well. Chaining 5 dense layers with tabular data also looks like you don’t really know what you are doing and just using deep learning because it’s all the rage.
My recommendation is to first read up on the basics of ML and about what Cross-Validation is, for what to use it and why to use it and then also about splitting training and test set and why you should do that. Covering that is simply not part of a reply on a forum as books have been written about these topics.
Hint: Feature selection also must only be done on the training set and hence inside a cross-validation loop (the knime examples in that regard are rather poor and way to simplistic) and the normalize must come before low variance filter!!!
Then you should play with classical ML like Random Forest and only after you get comfortable with it (months at least) would I even try to look into DNNs. For such tabular data random forest or xgboost are better than Neural networks and orders of magnitude faster.
Still simplified a more sensible workflow (just 1 train/test split, don’t do it like this you need CV for parameter optimization and so forth) would look like this:
M14.1_RF.knwf (1.7 MB)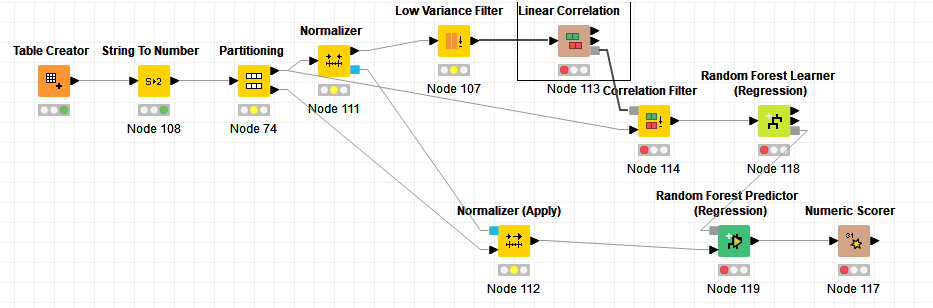
Still this gives basically random results. I also wonder what all the Integer columns are. Looks like categorical data. In that case they must be handled accordingly and the ML algorithm chosen accordingly (not tree-based).
@kienerj thanks for your reply.
I am in the field of ML and Knime for 7 years now and I hope I know why we use CV and the other bits. 
I asked for help after I tried different algorithms including RF.
I believe that it is a question of preprocessing ad interpreting the metrics more than the algorithm itself.
I shared my data with a generic workflow to see what people would suggest correct in the workflow.
I believe there is no need to normalization with RF and I used the table to make the data more accessible. Currently R2 is 50% which is not great for regression.
I started the DNN recently with these data as a desperate attempt to make it work where RF failed. I still believe I have not enough data to use it and it is giving a similar result as RF.
I hope there are artefacts or outliers in the data that I can safely detect and remove or there are other steps for the preprocessing before using ML.
True but you need to normalize before the low variance filter as else the entered variance value has a different meaning depending on the scale of each column (unless you keep it at 0 but you never know if you change it later on so I prefer to normalize always before low variance filter.
As mention in your shoes I would try to figure out the meaning of the integer/discrete columns. Are there in fact categorical columns or not? If yes as you know you can’t use them “as-is”.
@kienerj
I used the string to integer node because the read table node reads them as strings. All the data are numbers. So there are no categorical columns in my data.
I use the low variance columns just to remove the zeros columns.
I found some nodes to remove outliers. Do you recommend using them?
I am also wondering if the skewness in the target can be modified by applying some math modification such as sqrt…
in XGboost regression there are many parameters, which ones do you recommend to tune?
If you have an experience in ML publications, how far is my data to be in a publication-quality standard?
Keen to learn
First again about the features. So the integer columns have numerical meaning as in 20 is clearly bigger than 1 and is not encoding some category like Product type or such?
The feature engineering part greatly depends on domain knowledge, the actual meaning of the columns. If possible I would consult with your domain experts.
True, parameters matter a lot in xgboost. Number of boosting rounds and learning rater for sure. tree depth and alpha and lambda. But again very use-case dependent. For me 50-100 rounds is usually enough.
Never used the outliers node. I guess domain again matters. Is your data from “noisy” measurements? Then it would seem to make sense to do so. But better to just have more data. A robust model shouldn’t break due to some outliers in the data.
2 Likes
The huge performance difference seems to indicate a clear overfitting issue to me. Maybe you like to try some kind of regularization techniques first before trying to tweak every parameter?
br
This topic was automatically closed 182 days after the last reply. New replies are no longer allowed.