Hi,
I had created one figure used python view node(plotly) , the output as below.
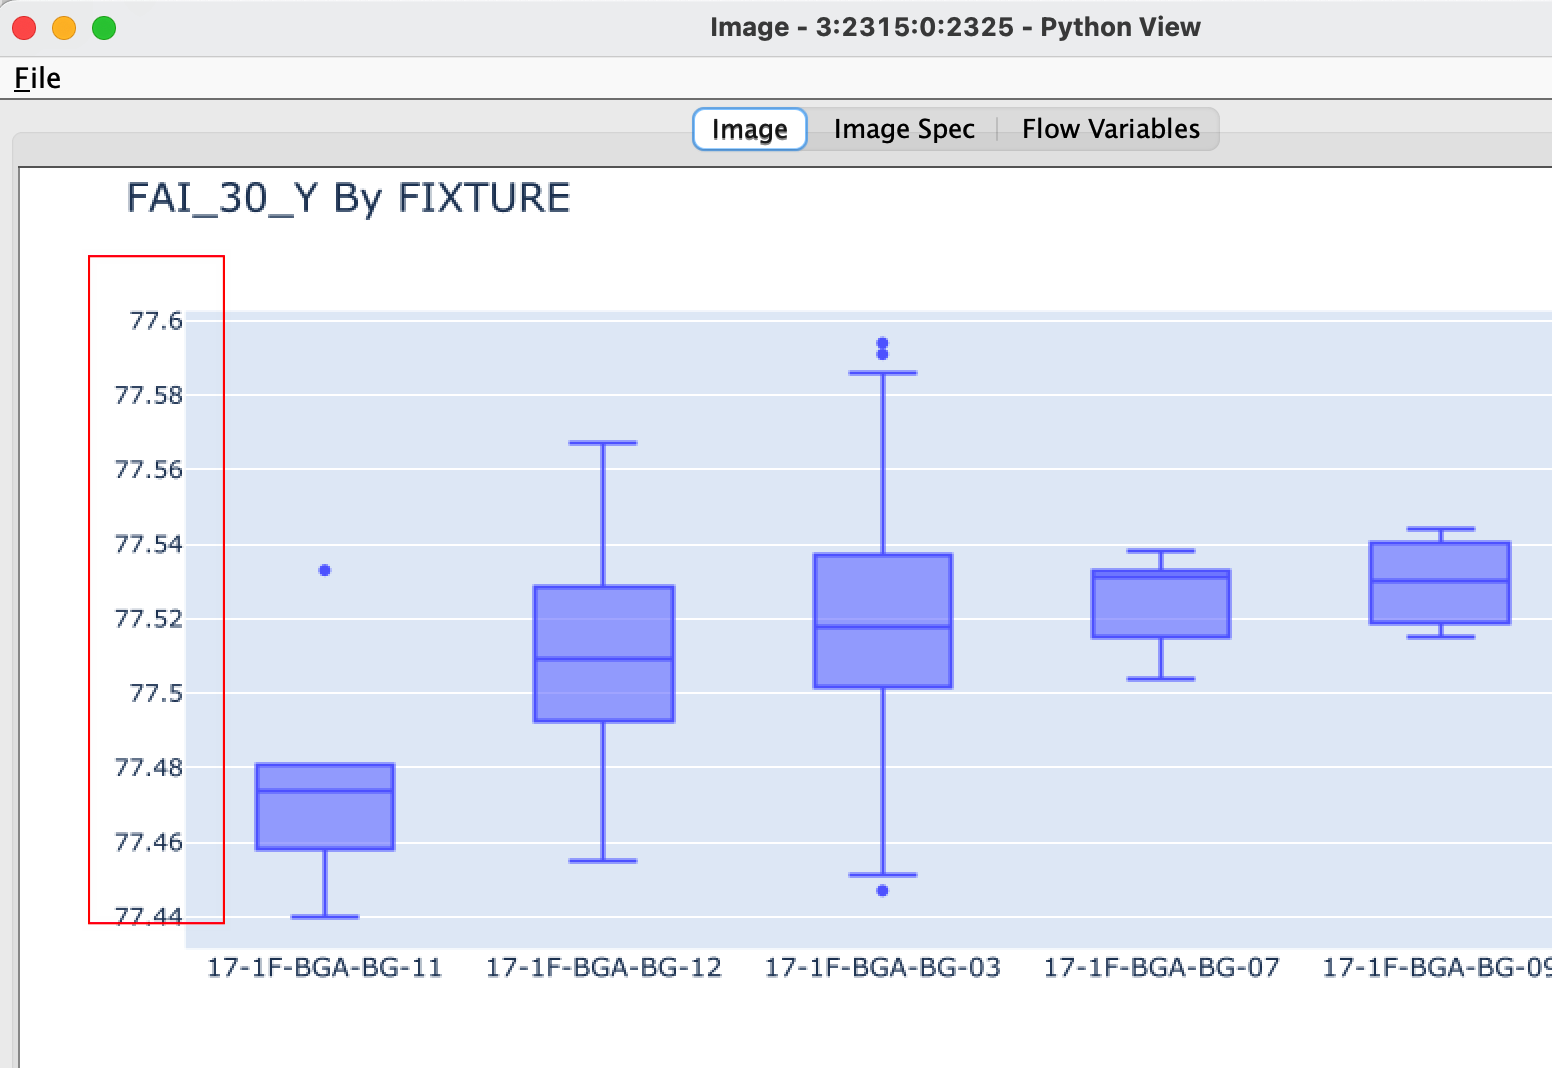
But after used image output widget node, there was no Y-axis value.
How to solve it?

My python code as below:
from io import BytesIO
#output_table_1 = input_table.copy()
import plotly.graph_objects as go
fig1 = go.Figure()
fig1.add_trace(go.Box(
y=input_table[‘FAIA031’],
x=input_table[‘SP_TO_BG_LINE’],
name=“A029_00BR+UMP”))
fig1.update_layout(boxmode=‘group’, title_text=’ FAI_30_Y By FIXTURE’, title_font_size=20,xaxis = dict(tickfont = dict(size=13))
,width=1000 #,height=600
)
fig1.update_xaxes(categoryorder=“mean ascending”)
#fig1.show()
Create buffer to write into
buffer = BytesIO()
Create plot and write it into the buffer
fig1.write_image(buffer, format=‘svg’)
The output is the content of the buffer
output_image = buffer.getvalue()