Hello,
I tried to apply the regression learner and predictor with my data like in the example of housing value prediction. But I get negative or near to zero R2.
I have 1000 samples and 20 descriptors.
I tried to build the model with and without PCA to reduce the number of features and I tried to apply -log to the response. I applied the normalisation, the low variance removal, the correlated variables removal. But all this did not improve the accuracy that is supposed to be close to 1 for R2.
Do you suggest other methods to improve accuracy?
Considering a negative R-square (R2) the blog entry below might be relevant (either your model is worse than the average or you have set an intercept).
Other than that you might have to tell us more about what your data is and what you want to do. Ideally, you could load up an example.
Hi @mlauber71,
I attach here my dataset in an excel sheet. The first column is the response and the other columns are the features.
I would like to build a robust predictive model and I think I have to get an R2 near to 1 after k-fold cross validation.
I get always R2 near from zero.
Please let me know if you need more details.
It doesn’t matter which regression algorithm is used as far as I get a good model that I can used on external data.
Thanks,preprocessed-data1.xlsx (414.7 KB)
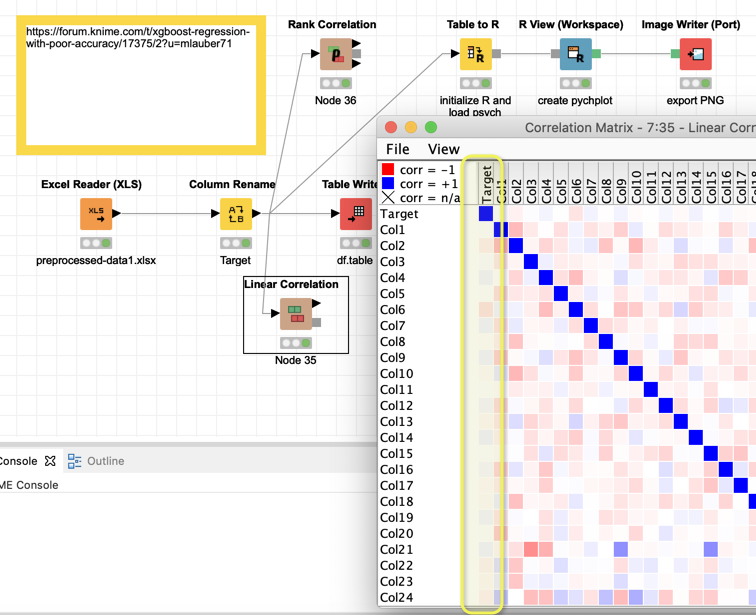
The problem is there is practically no correlation between the Target (1st column) and any of the other variables. So it will not be possible to have a good model.
it means if you make assumption like R2 should be very good, you need to back that up with facts or say a hypothesis why this should be so. Especially because if you get a high R2, the first question you should ask is where you made an error and had data leakage because real-world data sets hardly ever get very high R2.
And as far as i can tell from my short look at the data, it doesn’t seem to be possible to make a usable model quickly with standard techniques. Maybe, just maybe you could do some feature engineering but for that you need to know and understand the problems domain.
Dear @mlauber71,
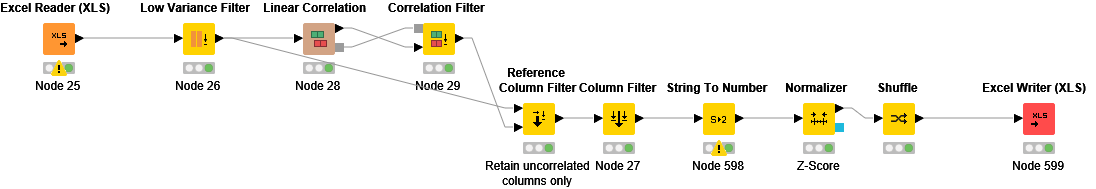
I used this workflow to preporcess my data.
I included the response to discard the correlated features to the response. So I deleted the response from the correlation filter.
The correlation filter is there to filter explaining variables that basically have the same information (with regard to the target) so if two of your variables are highly correlated you would just keep one. But you would want to keep all variables that are highly correlated towards the target variable.
I think this is the reason why your models are not good.
Hi @mlauber71,
This is what I tried. The correlation filter removed 3 features and end up by a dataset of 1170 samples and 25 features.
From what I understood, having a high correlation between one or two features will give like in case of multiple regression a predictive model with these features having high regression coefficients.
In my case, there is no feature high highly correlated with the response but they all contribute, so they all should contribute. All the regression models that I found in Knime failed to give R2 higher than 0.1
Then, I changed the strategy and converted the response from numeric to 2 categories high and low. The models still are very poor and the best I could reach was 0.52 accuracy which closer to the randomness.
In addition @mlauber71 tree-based algorithms are immune to multi-collinearity and normalization is not necessary. So if you want the XGBoost there is no need to use a correlation filter and normalzer from the beginning. Try to make a simple base-line model (algorithm) and try to improve from there. But with a quick look at your (pre-processed) data set I agree that it’s not possible to have a good model.
gr. Hans
@HansS, @mlauber71 , @beginner
Is it possible to check that some samples created high noise in the model?
For the response,is applying -log necessary for the regression problem?
Do you think reducing the dimensionality with PCA is important in my case?
PS: I chose a correlation filter threshold of 0.9 and low variance filter of 0.5, for the PCA I kept 0.8 of the variance.
From my perspective you should start with something more simple and see if there is any correlation there and then try with a basic model.
Outlier removal, normalisation/log transformation, PCA all that might help but if nothing is there in the first place no model- or data-preparation voodoo will get you anywhere.
You should think about what your variables represent with regards towards the Target and what the setting is, what a line does represent and what the ‘setting’ concerning time. Basically how your data set (and target) does represent your business question.
This is already included in the example data or you did that after the fact?
If that was already applied to example data, then maybe upload it without anything applied.
PCA and low variance need normalization before and especially for low variance filter you should use a technique that doesn’t affect the variance so easiest is simply to to minmax (0-1) scaling and then variance of 0.5 as filter is waaaay too high. in fact probably best to not filter on variance at and just filter based on correlation. Trees / xgboost should handle almost constant columns easily while they can be negatively affected by correlated features.
@mlauber71, Is it possible to put the configuration that you used for table to R and R view(workspace) to plot the the correlation. It is not included in the workflow attached in your reply.
Thanks,
I am not 100% sure what you are looking for. The nodes should be in the KNIME workflow called “m_001_load_data”. The R code is just like this, using the R package psych:
library(psych)
titel ← “Correlations (Pearson 1/-1 maximum)”
pairs.panels(knime.in,
method = “pearson”, # correlation method pearson, kendall, spearman
hist.col = “#00AFBB”,
density = TRUE, # show density plots
ellipses = TRUE, # show correlation ellipses
main = titel
)
@mlauber71,
I have Knime 4. I tried to search in the examples for the workflow “m_001_load_data” but it is not there.
@beginner@HansS
I tried to transform my regression problem to classification then I use SMOTE node to enrich my dataset.
This improved the accuracy but I am not sure if this is considered as a kind of cheating.
Thanks,
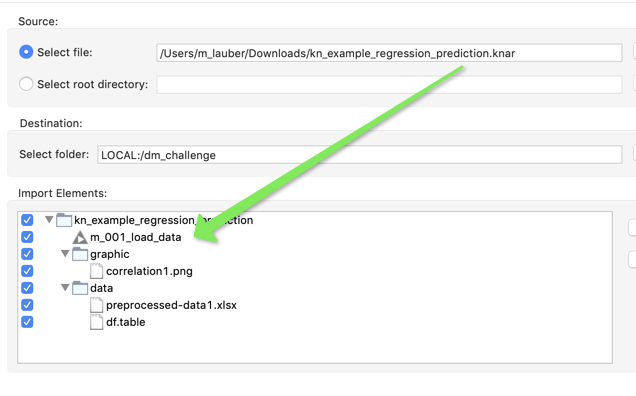
I checked again and the workflow is in the folder of the “kn_example_regression_prediction.knar” I attached to my posting above. Maybe you could check again.
Besides the fact I don’t like SMOTE as it doesn’t work and scale in my use-cases, you need to only use the synthetic classes for training and absolutely not for validation.
Instead of using SMOTE, use class weights. Much cleaner approach.