Hi,
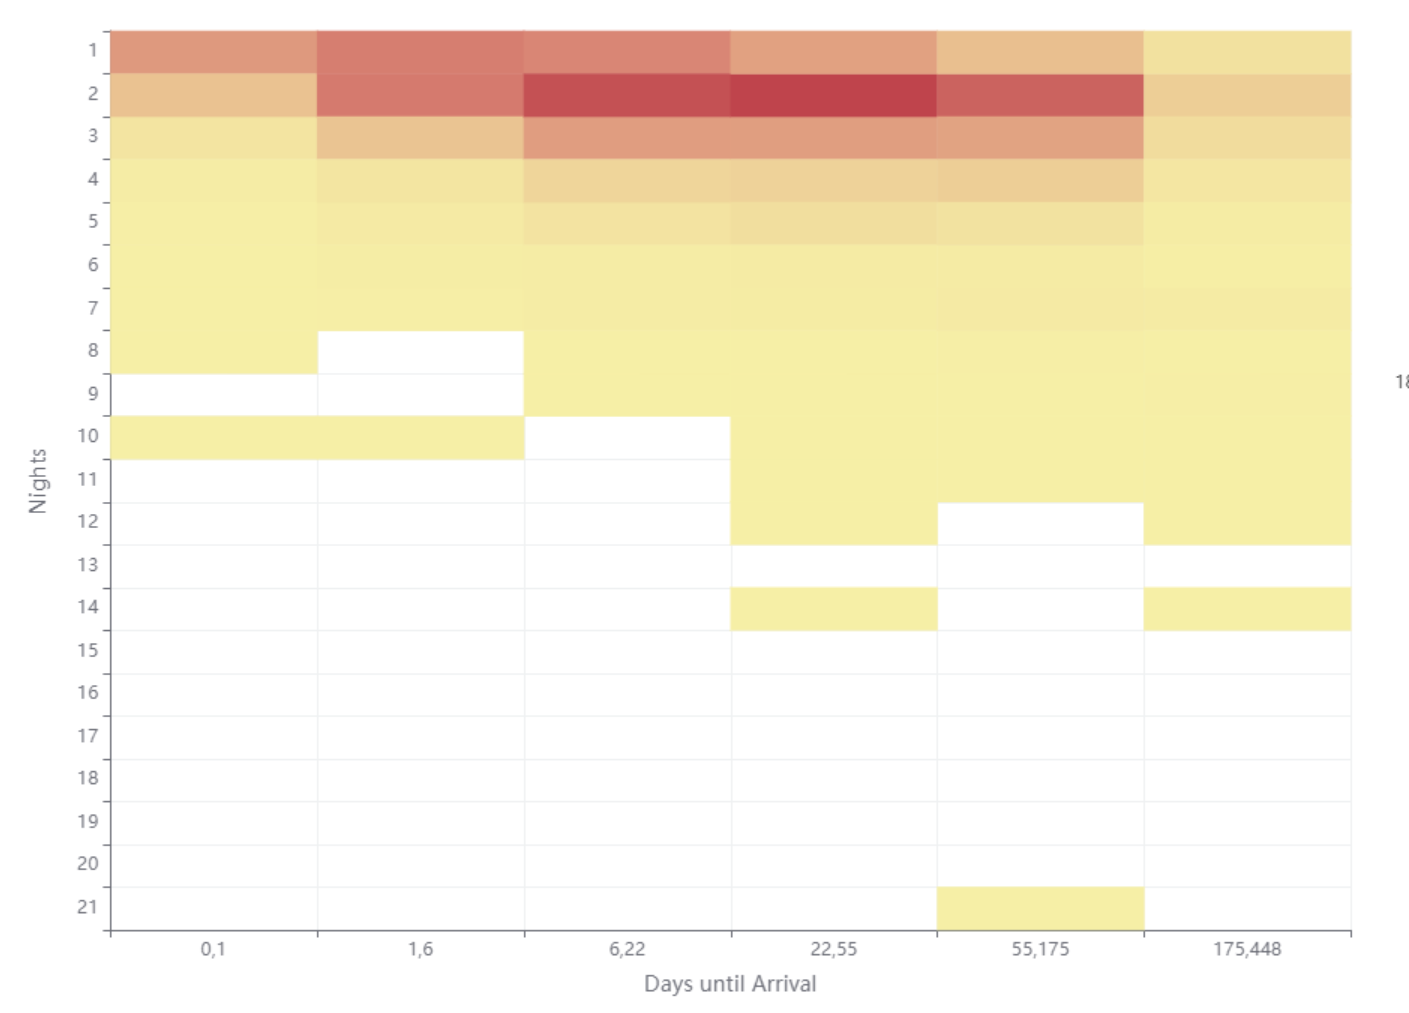
I noticed a visual inconsistency where the y-axis is hidden behind the data but the x-axis is properly displayed. Likely a z-index issue …
Best
Mike
Hi,
I noticed a visual inconsistency where the y-axis is hidden behind the data but the x-axis is properly displayed. Likely a z-index issue …
Best
Mike
Hi Mike,
thanks for reporting. We also noticed this (internal ticket reference UIEXT-579), but did not have time to tackle this yet.
The plotting library that we use (ECharts) defaults to this behavior, e.g., also with the dots in the Scatter Plot). So, this may be a bigger effort to get a really consistent look.
Thank you,
nan
Hi @nan,
thanks for letting me know. Since it’s html and CSS-support has been requested to get added again, wouldn’t this approach be a interims fallback?
Best
Mike