Hi All
First time poster but long time reader of the forum and the great wisdom it contains.
I am having some issues developing a fairly simple workflow to deal with some traffic data.
Unfortunately the data is not provided in a consistent format so column headers change and there are blank columns in some of the supplied data.
The workflow needs to simply opens all of the spreadsheets matching the filter and then writes then in a single workbook with a sheet for the AM peak, PM peak and 24 hour volumes.
The data is split into a pattern of 13 columns that provide information on different vehicles. Each pattern represents a “movement” e.g. the first one is the left turn, the second the through movement etc.
Refer to sample below:
And this needs to be changed to:
For future manipulation outside of KNIME I need to transpose the 13 columns for each movement into a single row which means for each intersection there could possibly be up to 12 rows.
I have used loops to read in different part of the spreadsheet to identify each “movement” but not all movements are appearing in the output and I am getting an error with the writing of the data within the loop with the message file in use.
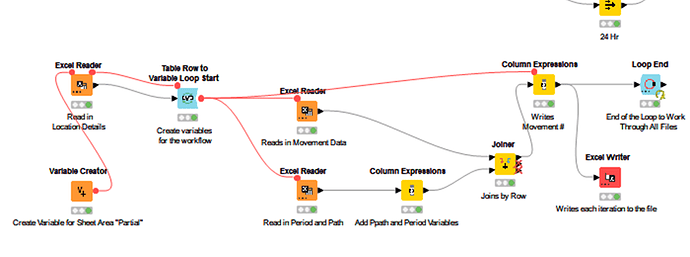
Extracts of workflow
Step 1 opens all of the files and creates a single excel file with a sheet for AM, PM and 24 hours counts.
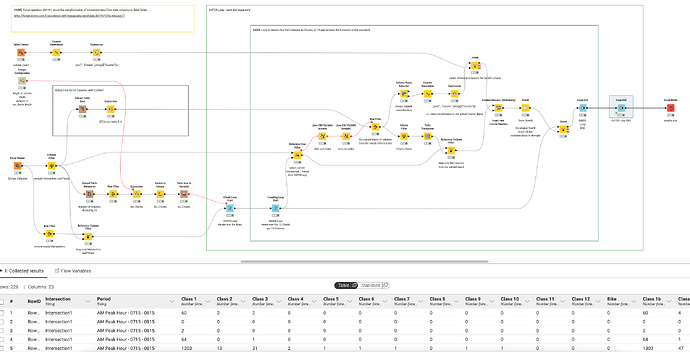
Step 2 – reconfigure the data
The problem workflow. This reads in different parts of the Excel workbook i.e. in 13 columns chunks and writes it out.
The looping part is not working correctly. If I move the writing of the Excel file to outside of the loop the data is not written in 13 columns it is “staggered” as per the original location of the data.
Any suggestions on how to overcome this issue or a different approach? Is there a setting I am missing in the Excel writer?
I am sure that there is a simple solution to this but I am yet to find it and I have searched the forums.
Thanks for any assistance.


