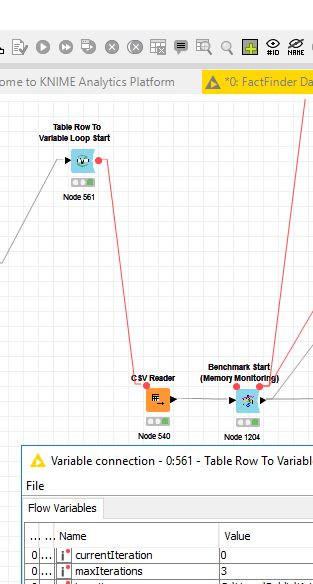
I’ve noticed that by placing a benchmark node within a table row to variable loop, it’s looping just once. After moving it out it worked again but it’s rather tricky to collect meaningful information about possible memory leakage.
Edit: Modified the workflow but the issue still persists. By deselecting all nodes after start execution of everything it does not continue to run after the first iteration.
In fact if seems that by selecting the outer table row to variable loop the variable connection from the CSV reader “breaks” something. Not sure if that’s an CSA reader or benchmark node issue then.
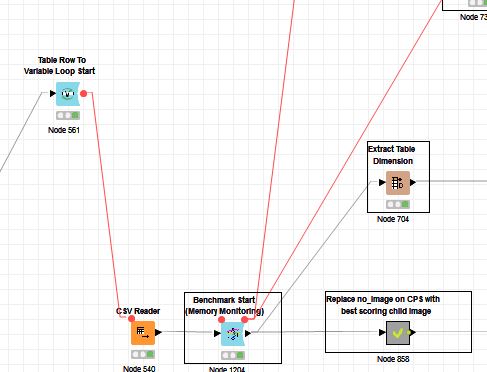
Update: Reason seems to be found in the end of the workflow. No error or warning was thrown but upon “rewiring” the workflow now runs as desired. What I presumably did wrong was not closing a branch directly through a data port but rather through a variable port.
Firstly, it looks like you’ve solved the problem - is that a correct assumption on my part?
The Benchmark loops only currently exist with the standard KNIME table ports (extra node versions could be added with other port types, e.g. flow variable if that helps you). But, you should be able to terminate your outer Table row to variable loop start with e.g. a Variable loop end node if that makes your workflow work better.
yes, I managed to resolve it and thanks a lot for you suggestion. About other benchmark types I’d rather suggest to find one that actually collects or enables linking of benchmark data with each node.
Before discovering your awesome benchmark nodes I was using the timing node.
Thanks for the feedback - nice to know people are using the nodes.
Regards getting individual node timings within the loop, I don’t think that will be possible using the current method, which simply records the time at each loop start node execution, and again at each loop end node execution. The only workaround, which would be pretty ugly would be to surround each successive node in its own benchmark loop, or possibly something no doubt similarly ugly with the Timer Info... node output.
I will have a think about whether there is anything smarter that could be done (There might be - the ‘Timer Info…’ node and the ‘Select Loop’ context menu items both give some hints…!)
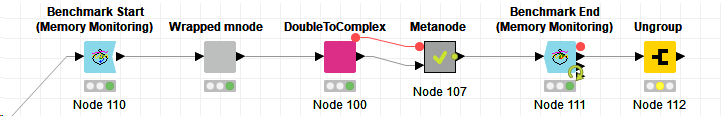
Actually, this suggestion looks eminently do-able following a bit of experimentation. A bit of experimentation with our internal version of these nodes (which are essentially identical to the external version!) looks to have worked, subject to some further testing (Dont worry about the ‘DoubleToComplex’ - that’s just a node in development here!):
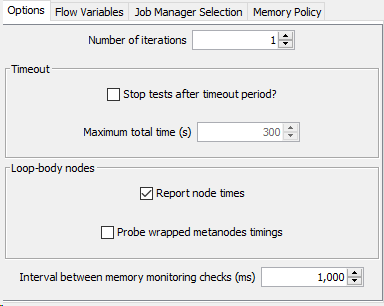
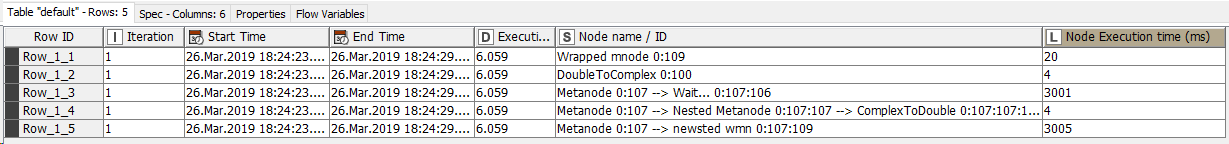
I have a loop with various metanodes and wrapped metanodes, with some nesting of each of those within the other, and a couple of new options in the Loop Start:
The ‘Report Node times’ option checks whether you want the legacy behaviour, or to add the new per-node timings, and the wrapped metanodes options checks whether you are worried about the detail of the wrapped metanodes, or only the top level timing. (Non-wrapped, ‘normal’ metanodes are always probed as they dont record top level timings as far as I can see)
The timings table is now modified slightly, such that for the example shown you see:
I will hopefully release this update within the next week or two - more here in when I do. @Iris - this may help your use case from the KNIME Summit too?
that looks wonderful! Can’t wait to get my hands on them. Being able to pin down nodes that consume a lot of resources, either time or memory wise, is more than helpful to improve efficiency and track down possible issues.
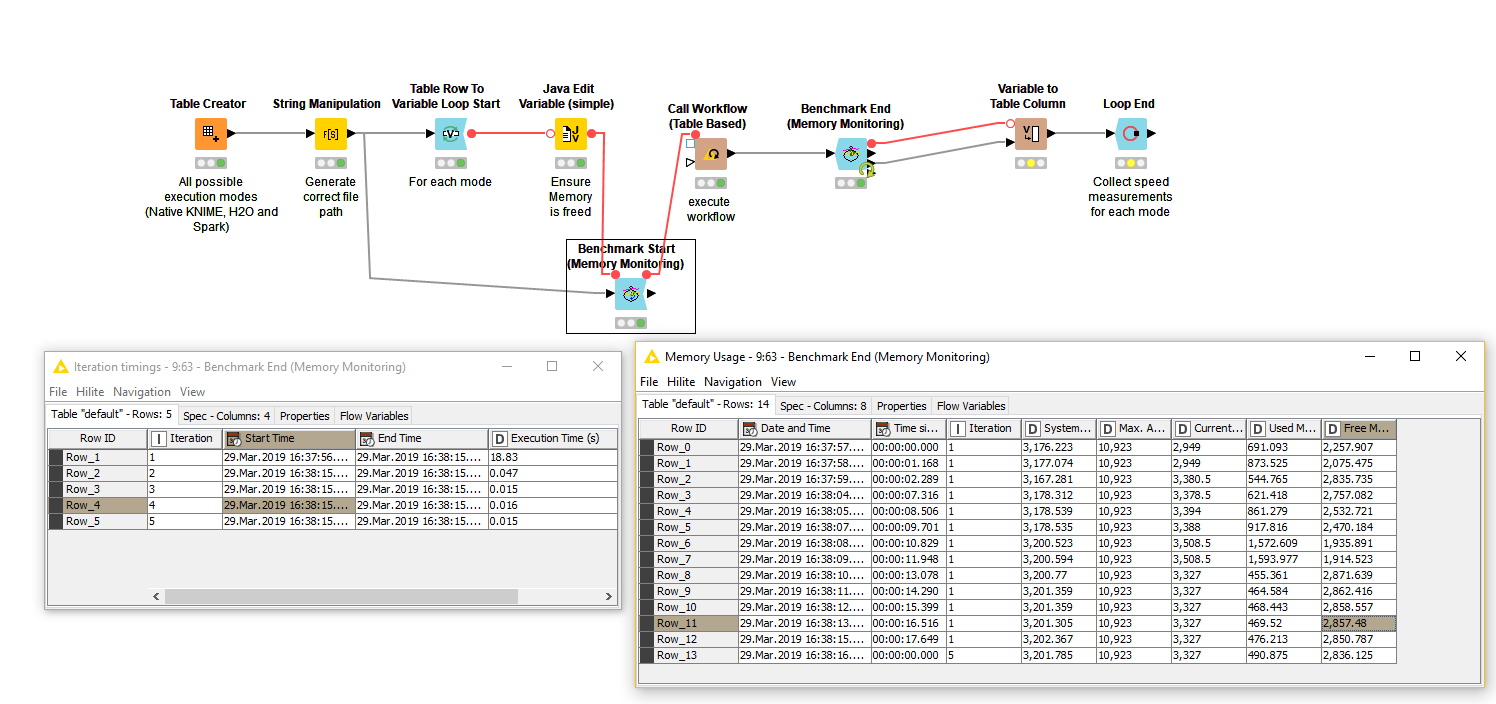
I think for me it is also not working. In the image I have multiple lines for iteration 1 and only one for 5 and none for the ones inbetween. Is this something which is fixed in the nightly as well?
(I guess the problem is my loopings… If I can give a feature request, I think it would be useful to have the third output port of the loop end also be able to collect the data tables instead of only using the last one)
I think what is happening is that after the first iteration the loops are so fast that the default memory interval is not catching them. If you change the value in the Benchmark Start for the ‘Interval between memory monitoring checks (ms)’ from 1000 (i.e. checking every 1 second) to say 10, then you should get more rows for the intervening iterations.
I’m just this minute about to push ‘Go’ on adding the new features for individual node timings to the nightly build (this has been a bit more protracted than I had anticipated for completely unrelated reasons!).
It looks like your use case would actually benefit from a flow variable version of the loop start too - which I will see if I can really make work with the current code - that won’t be in this release though!
Unfortunately, pressing ‘Go’ didn’t work this evening. Hopefully the build issue can be resolved next week. (The update built and all tests pass, but the build didn’t compete, which is a bit unusual!)