Hi all, need a little help in writing this workflow.
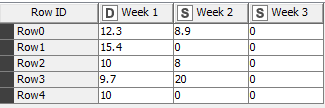
I want to have a workflow where I need to identify the week with 0. Then sum up the previous 2 weeks from this week with 0 (1 week if sitting in the second week) & then divide by the number of days in those 2 weeks to get the rate per day. Then I’ll multiply by the number of days in the week with 0 and write it over that cell.
Example for row0: The 0 is in week 3 so I’ll sum 12.3 and 8.9 (12.3+8.9 = 21.2) and divide by 12 (21.2/12 = 1.766…) then multiply by 3 to get 5.3. Then row0 should be 12.3 , 8.9 , 5.3.
Table of Number of days:
Have been stuck here for a few days already. Would appreciate any help!
@nicole1201 from my perspective the description is far from complete. What if there are two weeks with 0 in a row. How do we know how many days are in a week (7?, why sometimes 3). How many weeks can be there. Will the columns always be sorted in the correct order?
Could you provide examples as data in addition to screenshots?
The examples should include all possible variations that could happen like no zero or all zero or multiple zeros.
Let me change up slightly, I can take the sum across all weeks. Then divide by the number of days (with reference to the no. of days table I have - as shown above) in the weeks WITH number that is not 0. Then multiply by the number of days in the week with 0.
How do we know how many days in a week? - I have a separate table as attached in the question that will indicate how many days in that week. This is just dependent on my working days. So it’s subject to changes and I have another table for this data. There can be either 5/6 weeks, dependent on the month.
And yes, the columns will always be sorted in the correct order.
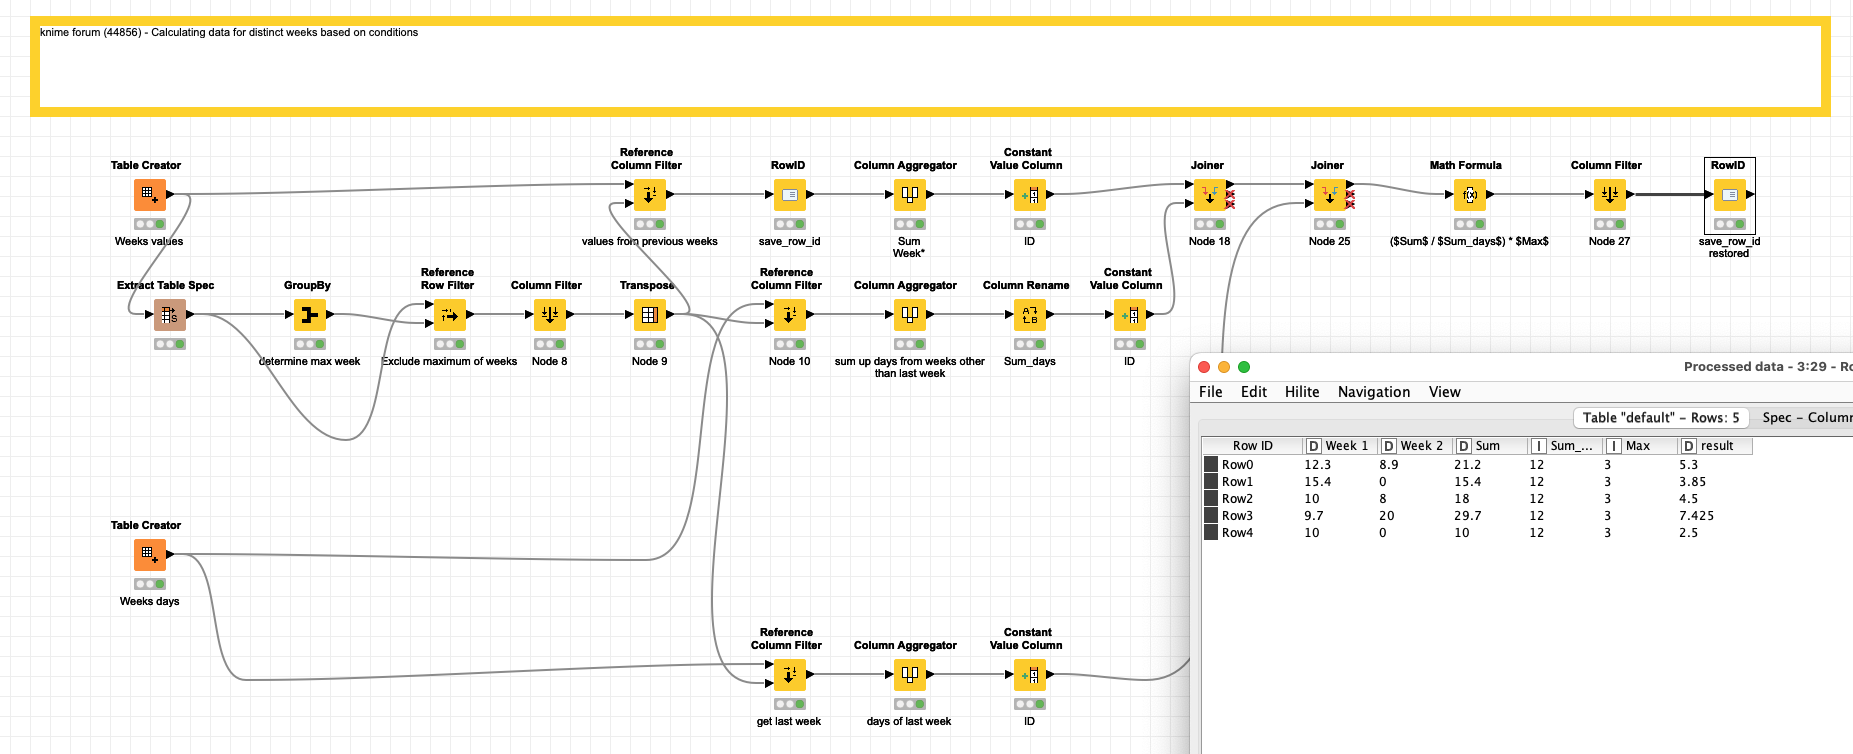
@nicole1201 I set up a workflow that uses your examples and calculates the values you want. To be honest I might think there are more aspects to your task than the ones that are covered by this example, but you might be able to adapt that: