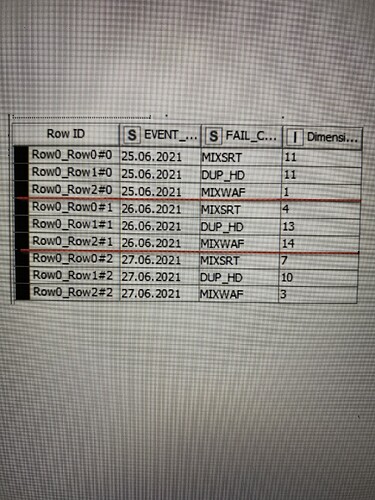
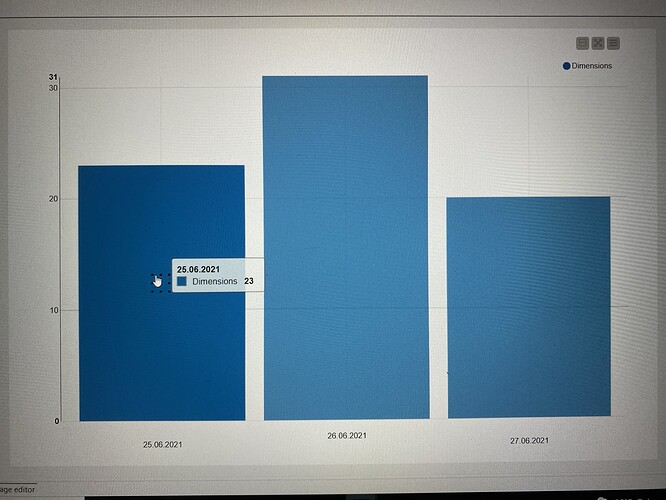
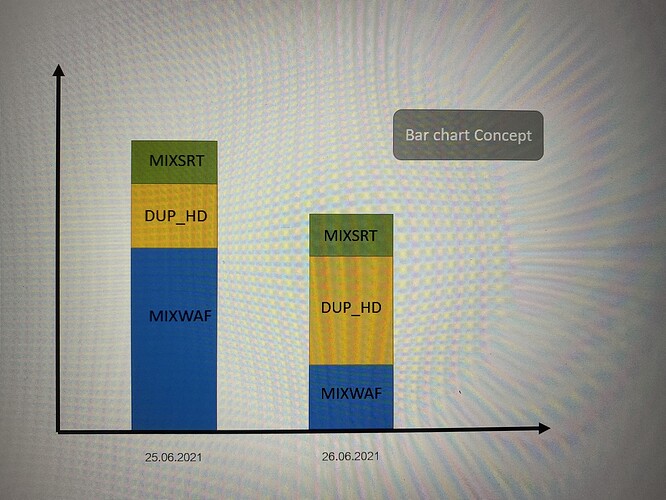
From table,I need show to bar chart,can’t change color. On day, I want to separate code (MIXSRT,DUP_HD,…) to stack within in day.(See image on concept example)
Hi @Nutjaree_W -
Take a look at the example workflow below, in particular the stacked bar chart section in the top middle. The trick here is to massage your data into the proper format, so take a look at what is coming out of the Table Reader node as well.
1 Like
This topic was automatically closed 182 days after the last reply. New replies are no longer allowed.


