Hi,
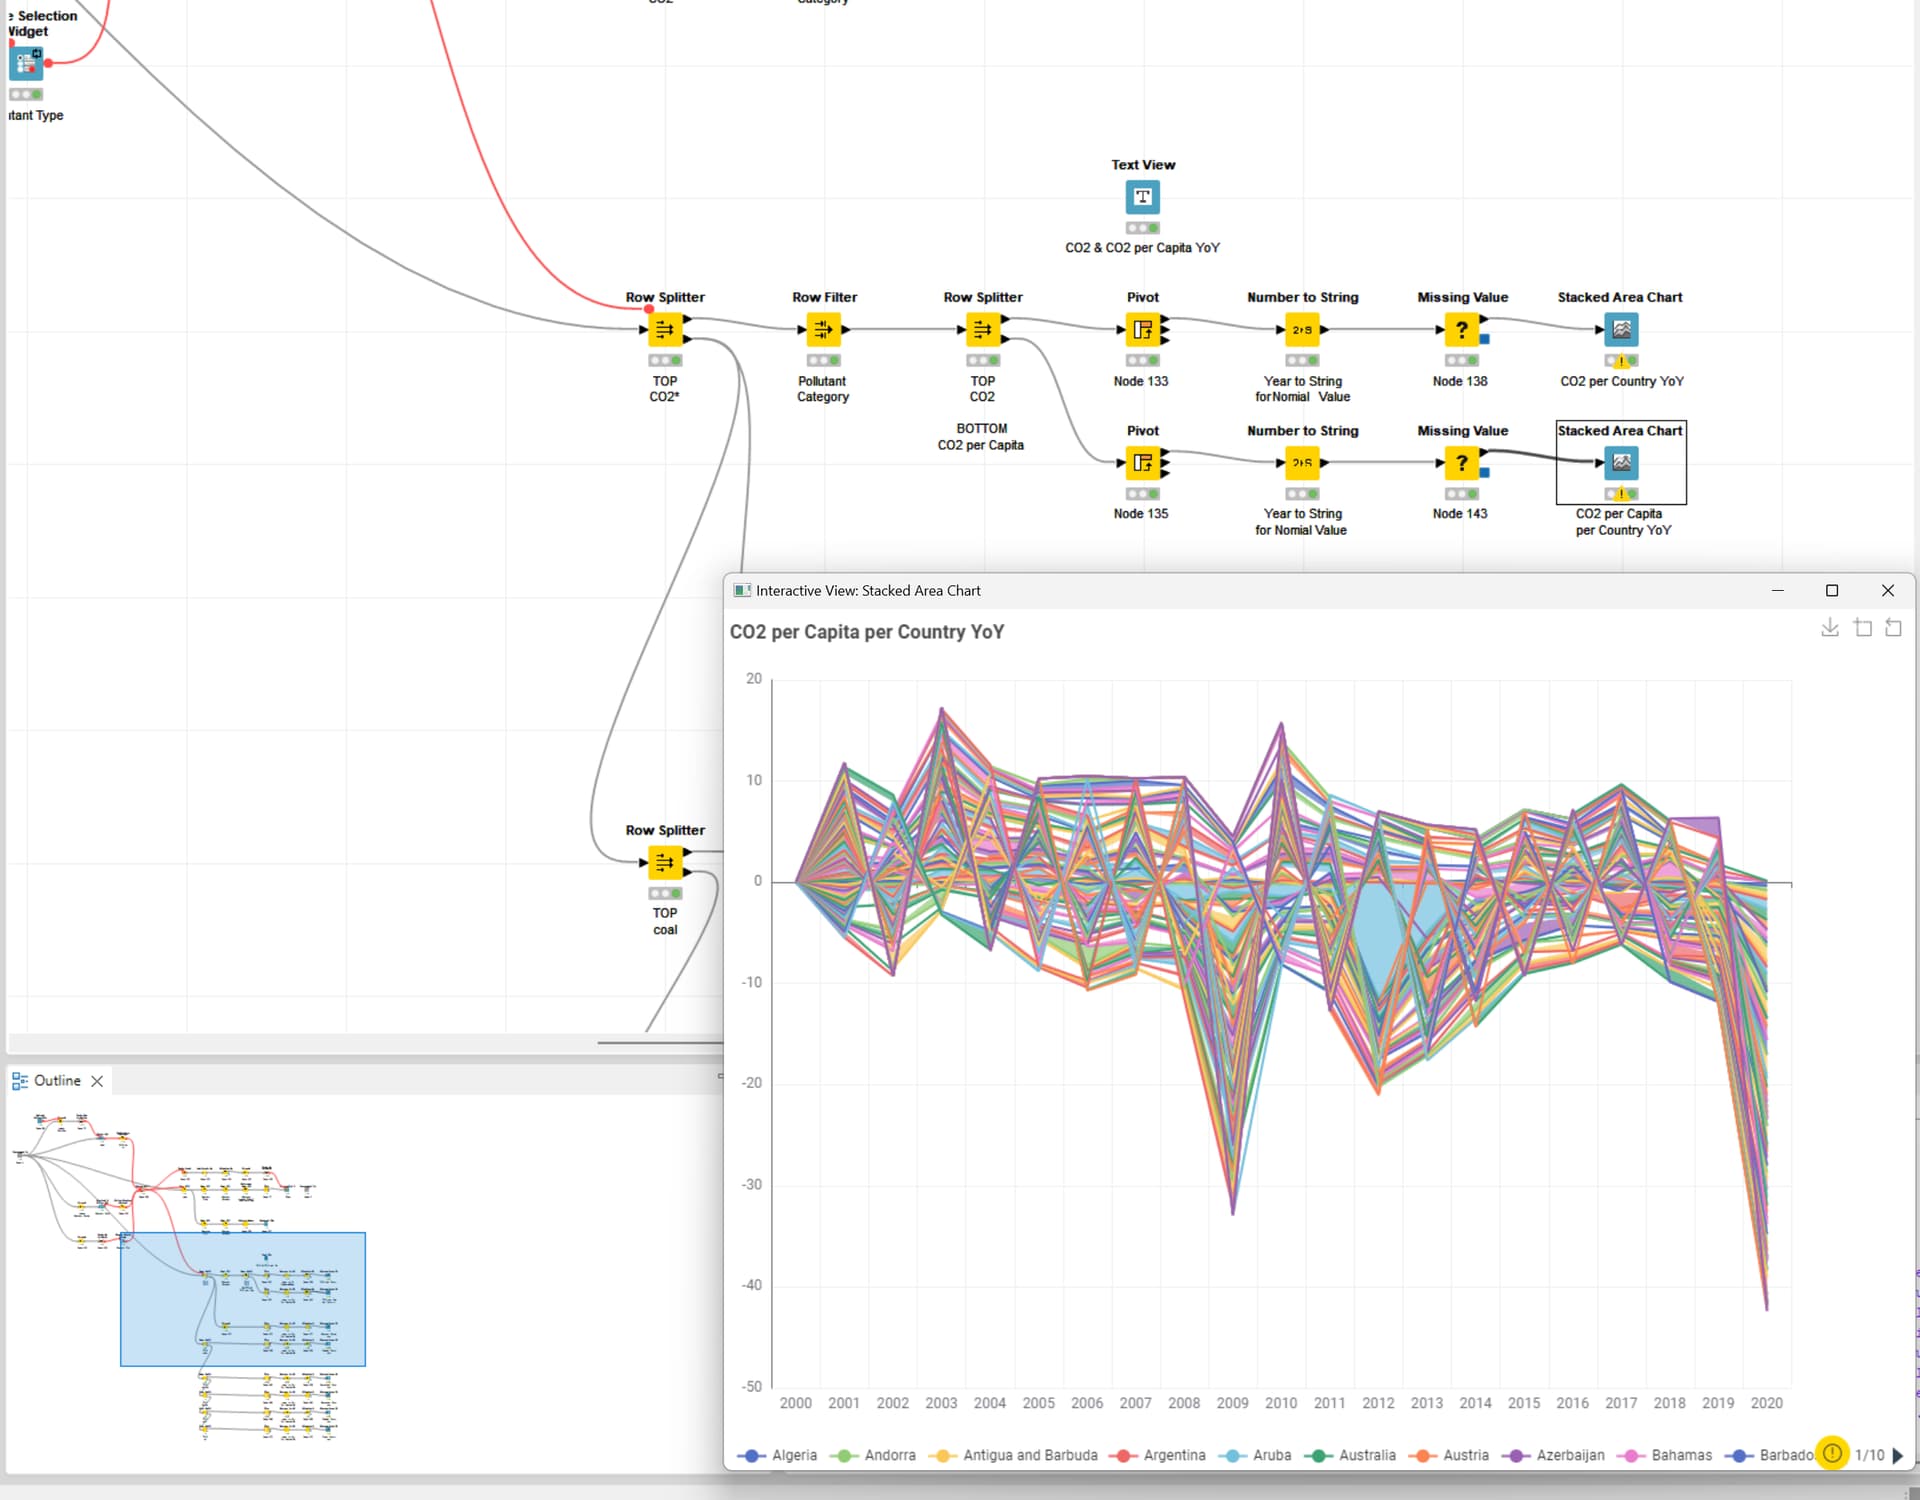
while working on the current Knime Data Challenege I calculated the change YoY and noticed the Stacked Area Chart complains about columns both containing positive and negative values. Consequentially, it stated they cannot be displayed.
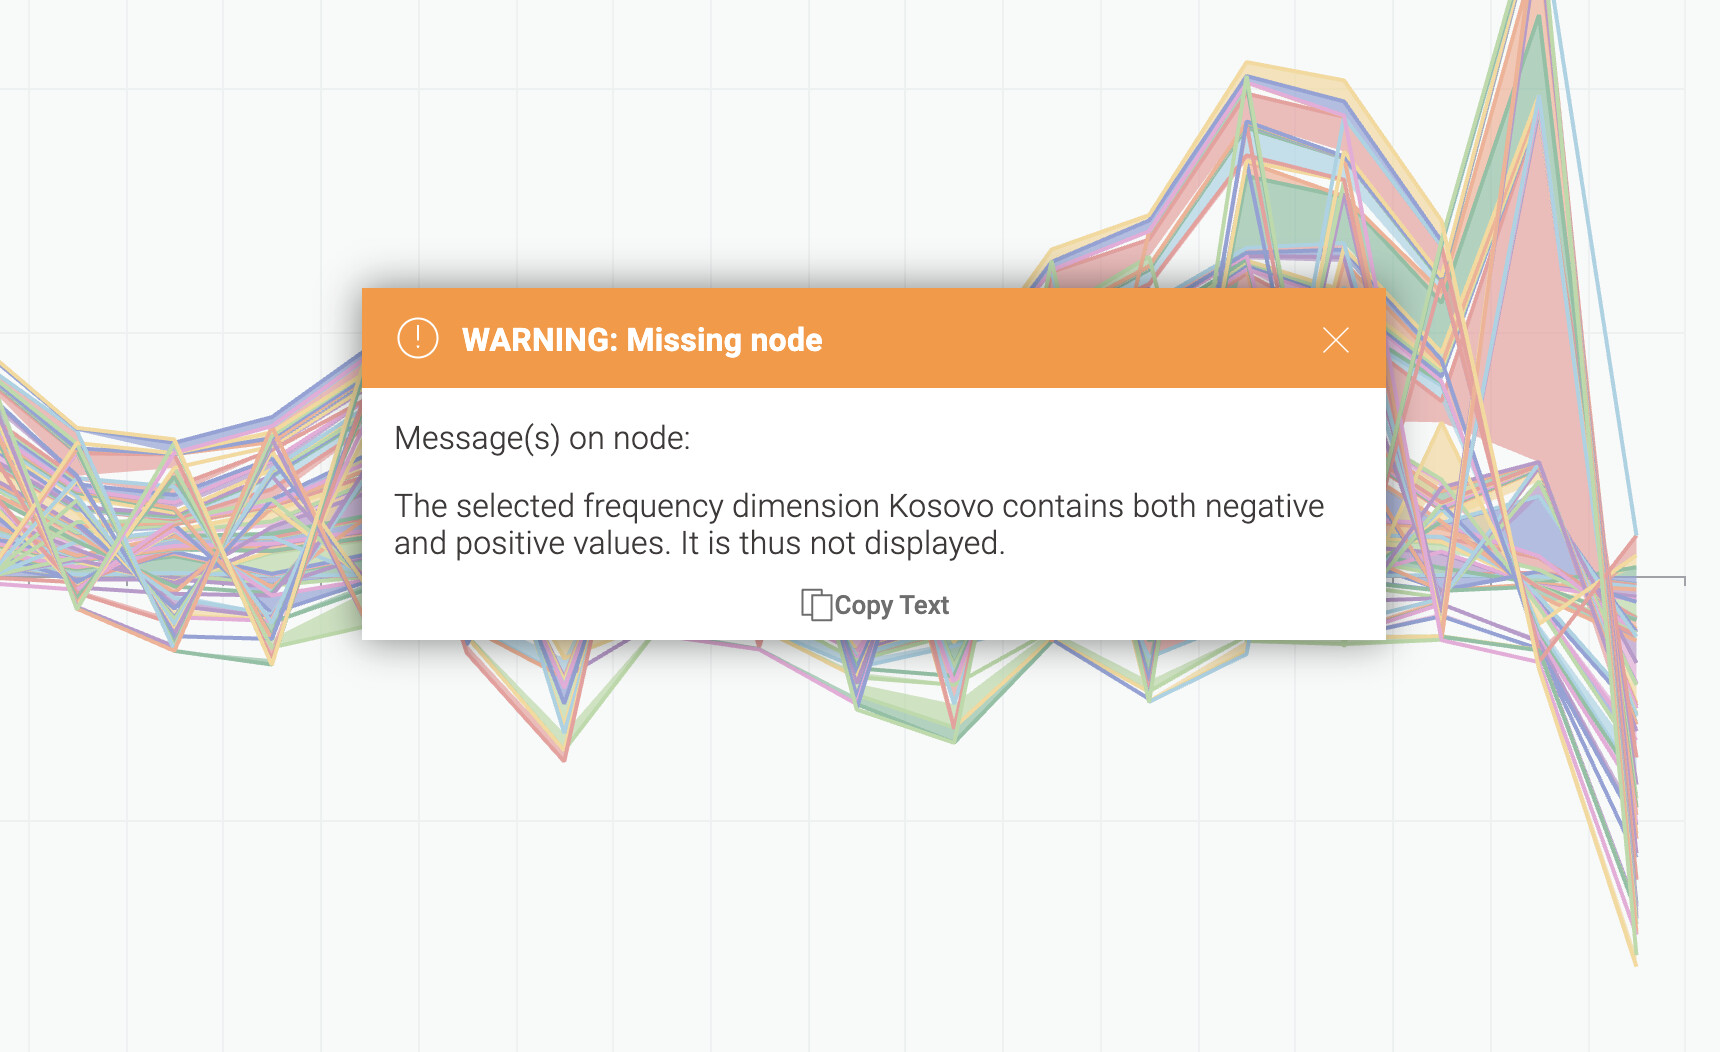
WARNING The selected frequency dimension United Arab Emirates contains both negative and positive values. It is thus not displayed.
Though, as seen in the screenshot below, pretty much all have values fluctuating between positive and negative and are still displayed. Is this a false positive?
I will post the test workflow soon.
Best
Mike
Thanks Mike! If you have a test workflow handy I can find someone to take a look.
Hi @ScottF,
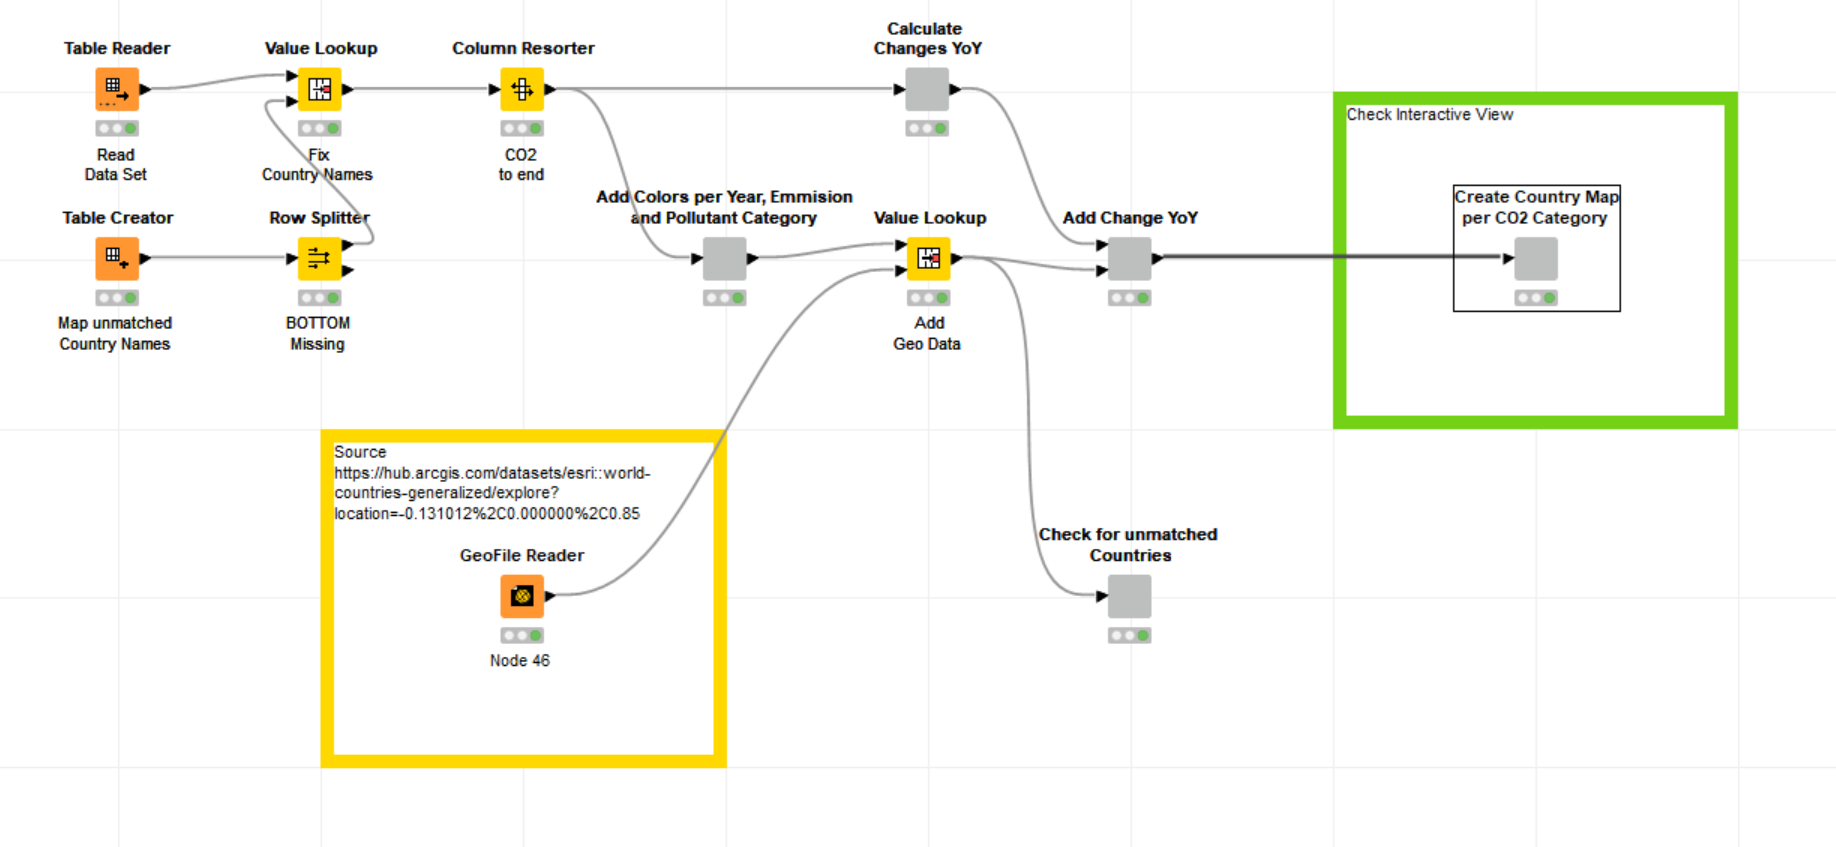
I missed updating that post. Thanks for bringing it back to my attention. Here is the test workflow. You will find the stacked area chart in question in the last component about in the center right
Best
Mike
1 Like
Hey @mwiegand,
I downloaded the worklfow and ran it and got the same warning you outlined.
It seems to be properly displaying both positive and negative values fine, so you are probably correct that it is a false positive that is happening.
I will create a ticket for this and send you the number once I get it up.
Thanks,
TL
Ticket AP-22732
Thanks for letting us know @mwiegand!
TL
2 Likes