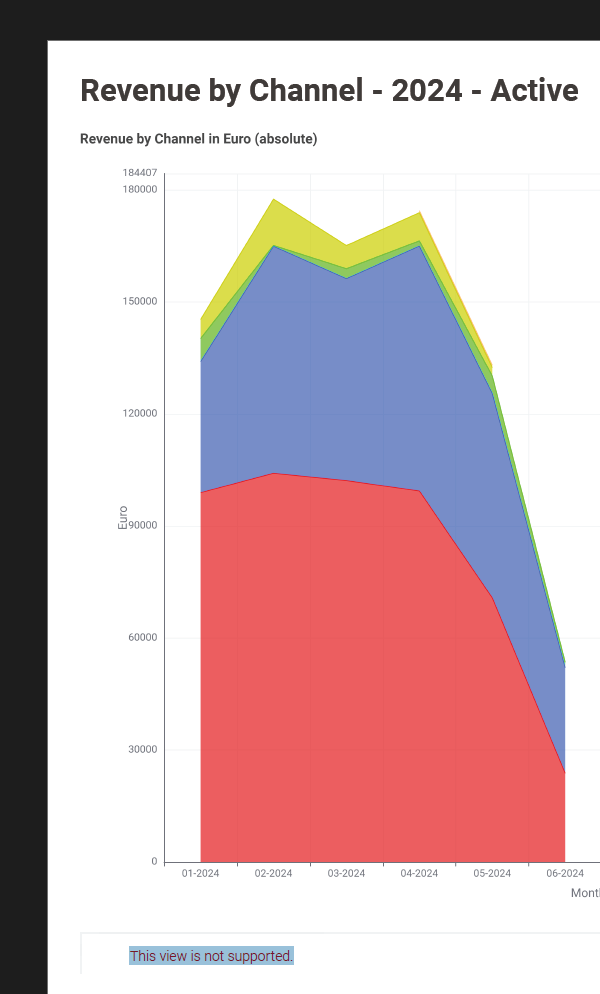
due to the lack of support of negative values by some chart nodes, I had to resort to using the Bar Chart (JavaScript) node. The node generates an SVG, which I personally prefer over PNG for a multitude of reasons,. Though, SVG is not supported in both, the PDF and HTML Report Writer.
it is not so much that the Report writers do not support SVG, but that the Reporting does not support the old JavaScript views (and also no interactive widgets).
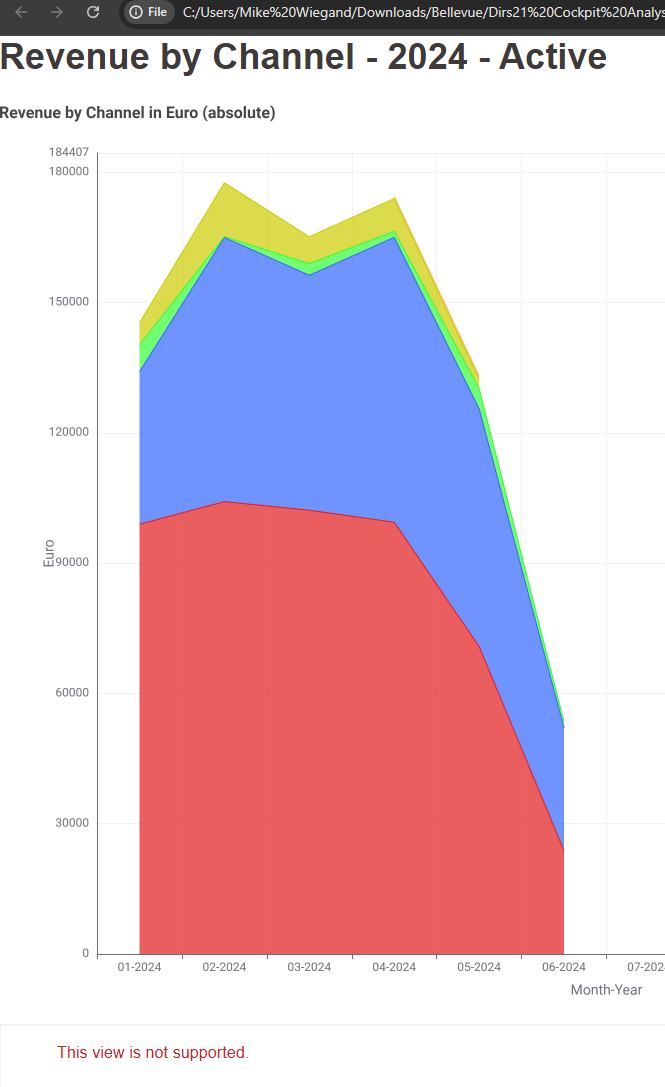
This is why it prints “This view is not supported” and not “Rendering SVG is not supported”.
Once the new views generate SVGs, which is actively being worked on (your second forum link), you will find they will be included in the report output and look as crisp as you would expect scalable graphics to look.