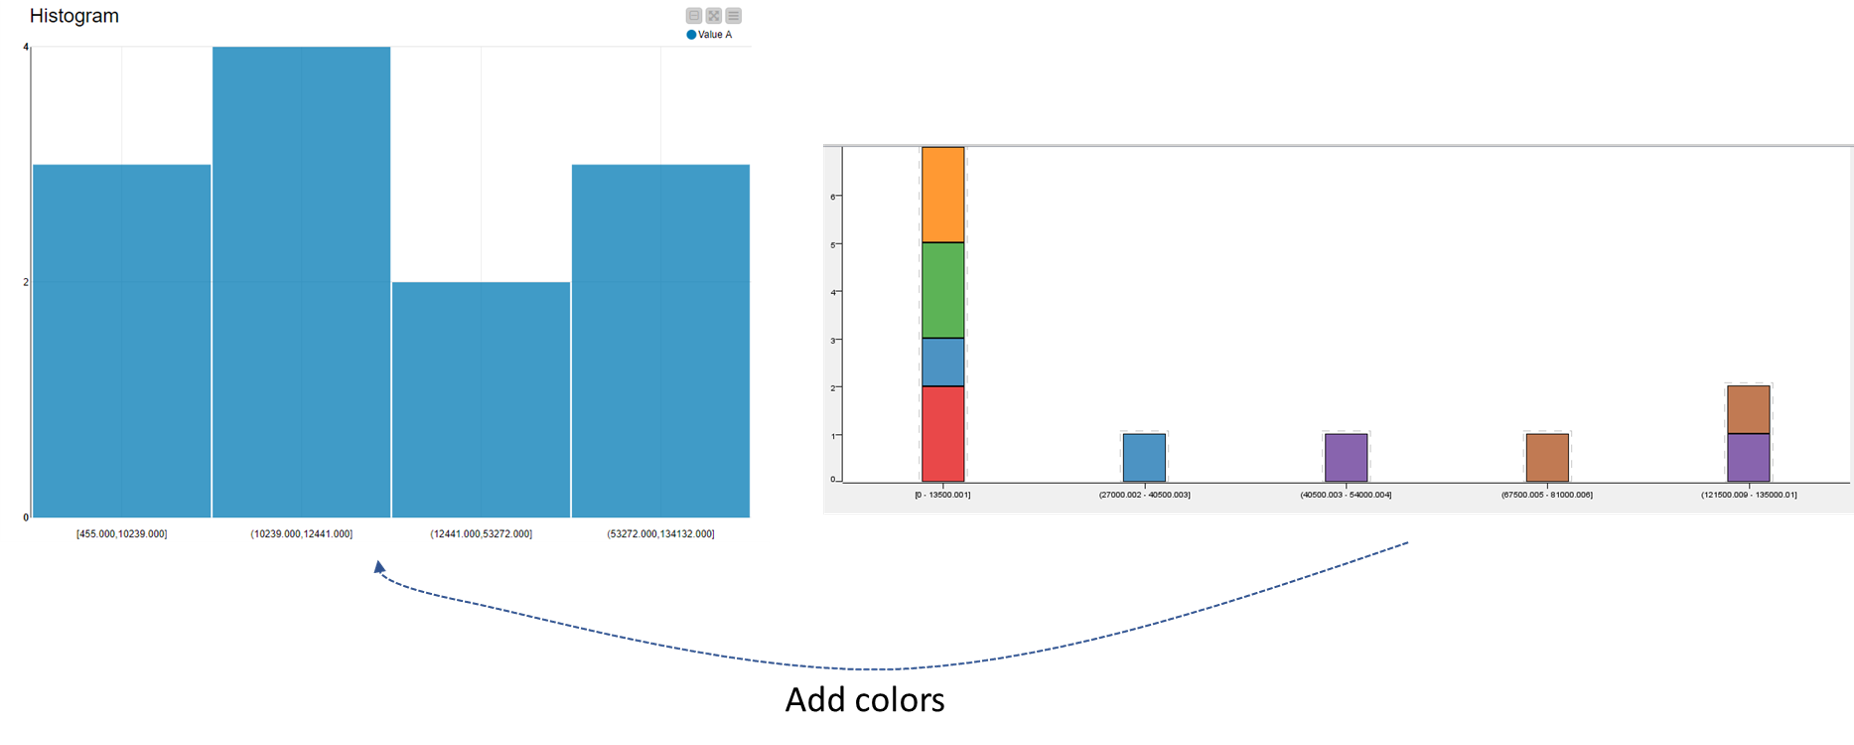
Hi everyone, I am trying to add color categories to the JavaScript Histogram but I am unable to do so. The node “Interactive Histogram Local” can add the colors based on a nominal column but due to the “real” data characteristics I need to bin based on Sample quantiles.
don’t think this is done automatically as in Interactive Histogram Local node. However workaround using Bar Chart node with logic outlined in this topic will hopefully be good enough:
Additional action for you to take is to use Auto-Binner node to get your bins based on sample quantiles as desired. This column will then be Category column in Bar Chart node’s configuration. Take a look, give it a try and if you’ll need workflow example drop me a message.
great! You can also share/upload workflows to KNIME Hub if you think others might benefit from it as then there are easier to find and more accessible.