I am wondering if there is a way to use the column header names in a math formula. I have 12 columns with dates: 1/31/2023, 2/28/2023, etc…
I was hoping to use the column expressions node for my “IF” formula that would compare other columns and then calculate the current column name. My formula is quite long so I will just shorten it up and abbreviate it:
If col A > col B
then column header(12/31/2023) + 2 days
I know in excel it’s fairly easy because the header name is in a certain cell and when I write my formula, in excel, I can include the cell that name is in. But I have searched all over knime and couldn’t find any questions or answers related to this.
Any help would be much appreciated, hopefully it’s an easy solution. I’ve just started using knime a month ago and created a few workflows so I have some working knowledge of knime.
I’m not quite sure how this node helps me in creating an IF statement to make a calculation based on the header name.
I see the first output just cleaves off the names and inserts them into the first row with no other data and the second port cleaves off the names with the original data in the rows.
I need to be able to use the header names, which are dates, in my calculation. So each column would have different values in the rows because the headers have different dates. Hopefully I’m describing that well enough or maybe I’m missing something from the extract column node.
Sorry I misunderstood your initial question. I understand it better now and you are right, my posted workflow does not answer your question but a different one. I have deleted it to prevent any future confusion of people looking in the forum for the right solution to your question.
Hi @jkrom , Would you be able to post a small example of how your data looks using just maybe 4 columns instead of the 12, along with a fuller explanation of the logic. I an confused about whether the dates are in the data or the column names (or both). Thanks.
As you mentioned in your post, there is not a straight forward conversion to your column names without some coding.
With base nodes you can ‘Extract Column Header’ and transpose them. Working the column names in rows will be easier aiming to manipulate them as date format.
Once applied your logical rules, columns in the source data can be renamed with the new evaluated column names by ‘Insert Column Header’ node.
If all these doesn’t sound familiar to you, better provide with a valid example of your challenge. So others can help.
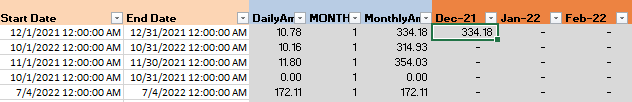
Here is a snapshot of my excel file. What my ‘IF’ formula in each cell under the months columns is trying to determine if the header of the column falls within the start and end dates to the left and then calculates the monthly amount. So cells under each month column have the monthly amount values, but those values are determined by the column header name, in this case the months. The dates are in the column names and the cells underneath the column names are monthly dollar amounts.
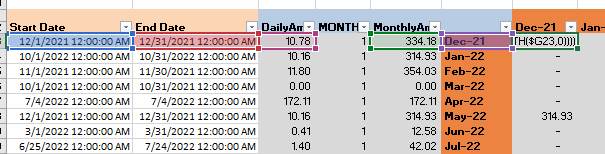
@gonhaddock I thought about transposing the column headers into rows then doing a formula in the months column, but I would need the formulas in each month column to be locked on one value in that new column like so…
I know I could use workflow variables, but I would need to update 12 variables each month. Is there a way to set one variable and have the rest feed off that one? So I just update the current month variable and then it creates the following or preceding 12 months?
Any other suggestions or routes to take would be welcomed. Hopefully this info was enough.
Hello @jkrom
I am getting a closer idea of the challenge, but it would be more clear if you post how your input data looks like, and what is the expected output. But looking at your sketch, I think the idea is captured…
If I’m right, as starting or source, and using Excel syntax; you have three columns: A:A to B:B [A:B] defining usage period start and end; a column C:C containing the ‘daily invoicing’ (invoicing granularity). And you want to disclose how much of this usage can be inputted on a monthly basis. Your column D:D is basically the usage start to end differential, I would consider to keep it in invoicing granularity (days) as in column C:C, because what you are doing is basically to assign the share about how many of these 30-31 days, will be invoiced within the different months.
I have an example that does it in a bit more complex context, as it estimates minutes working from servers (instead of complete days) in a monthly based periods, but it can be used as insights for your use case. I think all the logics that you need, are included in the workflow.
Let me know if further support is needed.
BR
PS.- The topic description doesn’t totally fit to the requested challenge.
As you can see, for this time reporting collection of workflows that I mentioned in the linked post; it is necessary to feed not only the month-year occurrence for the whole report, but the starting and ending reporting period in date or date&time format. 12 item list is not large however you may want to automatize this report with ‘configuration’ family selectors.
Once embedded them in a component, you can generate effortless the reporting format with 4 selectors:
Starting Month
Starting Year
Ending Month
Ending Year
Another option is automate reading month from system time (or select month, year as unique inputs) and define the window forward and backwards from current month (?). Then, if your task is always scheduled in the same environment, default values are correct for every run.
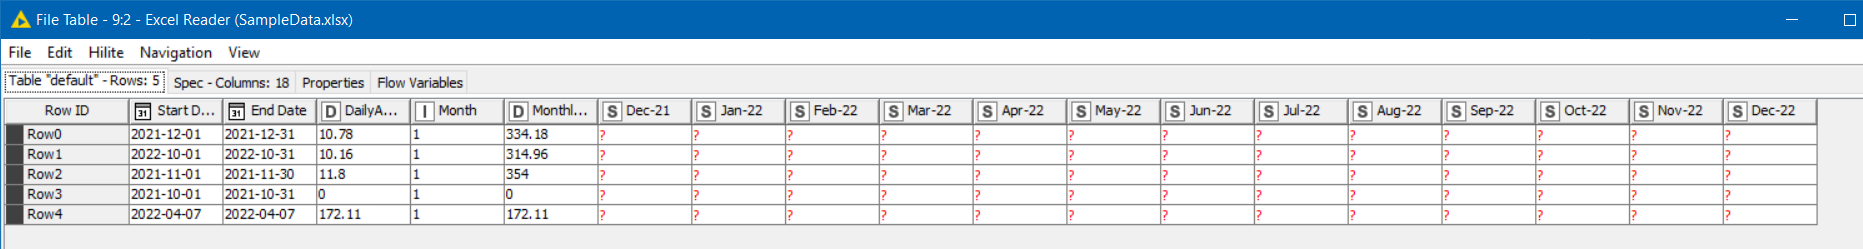
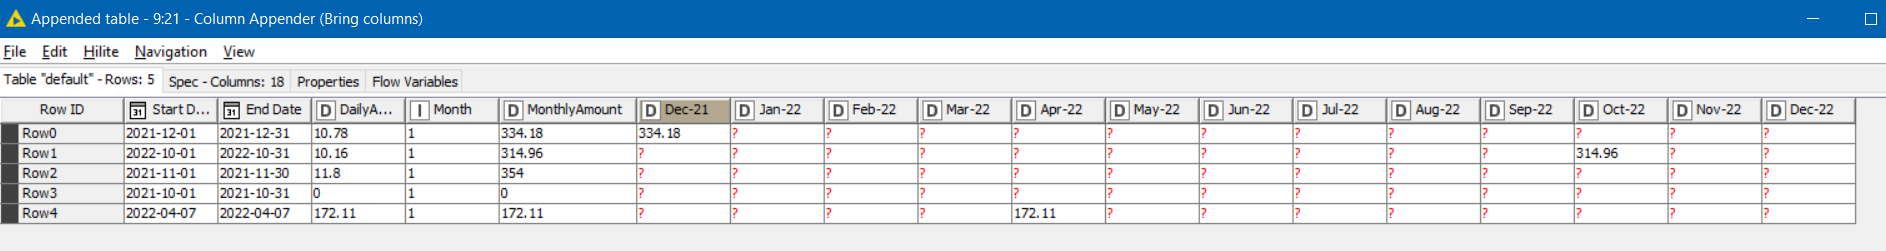
Without an actual spreadsheet, I have had to make some assumptions. One assumption here is that the column headings for the periods are String data rather than dates. If they are actually dates in the spreadsheet, then text such as “Dec-21”, “Jan-22” would appear in KNIME as 2021-12-01, 2022-01-01 and so on, because what you have in your screenshot is simply the rendering in Excel of these dates.
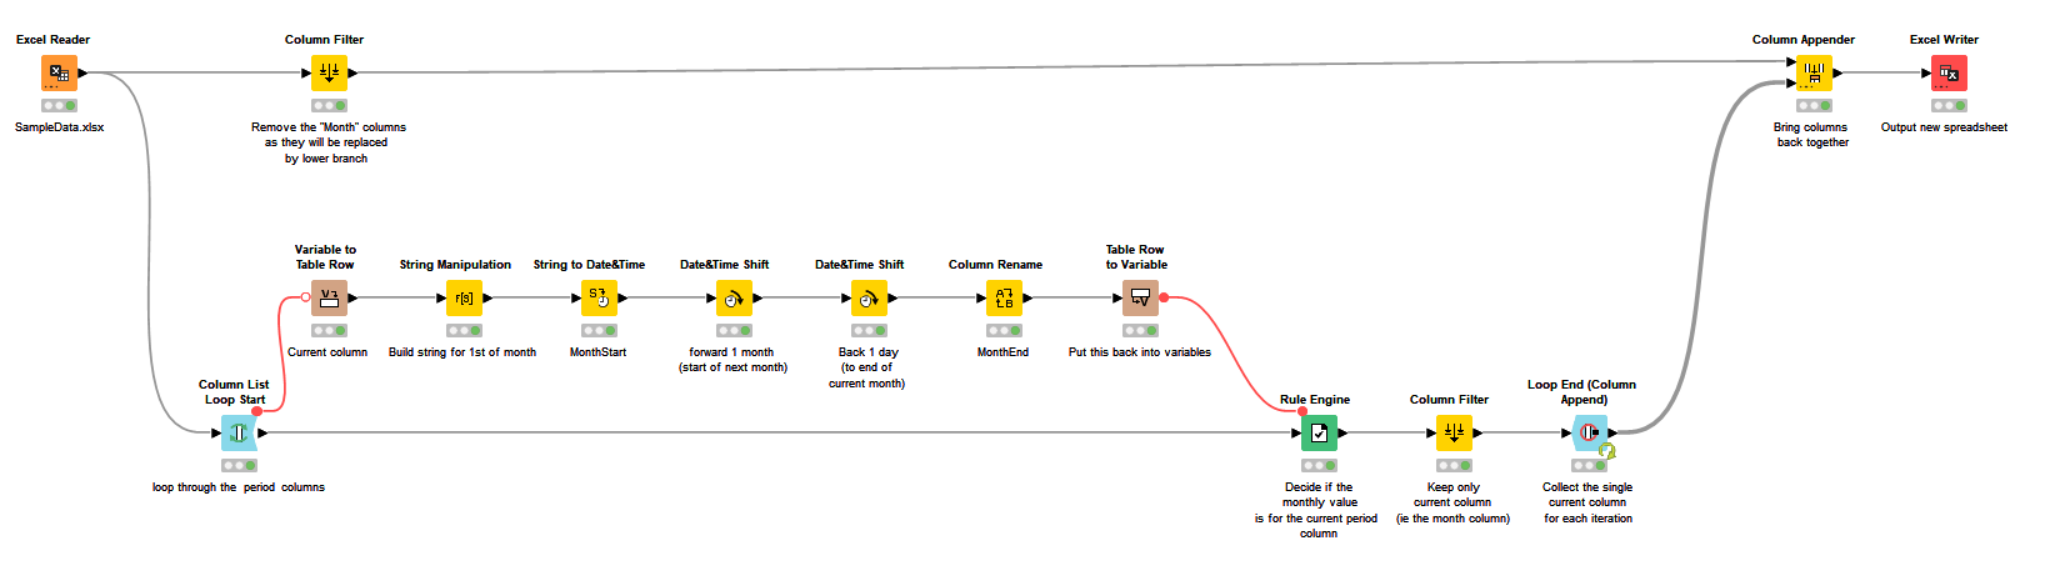
So here, I assume that they are strings, and that way when KNIME writes the new spreadsheet out, it can write these as strings and they look the same as your screenshot.
See the attached workflow. It works through each of the “period” columns in a loop, and if the date range is contained within the given period, defined by the column name, it applies the “MonthlyAmount” value to that column. At the end of the loop, the columns are collected and appended back to the “non-period” columns so they can be written to the output spreadsheet.