Dear Knimers,
I have a situation with Time Series. My questions and the data I’m working on are as follows:
1- a Covid Database (CSV, open access) with data from cases of all municipalities in my State (RS, Brazil). The original data are at:
< https://ti.saude.rs.gov.br/covid19/download >
Preprocessing data, sorted by confirmation dates (1 case by row), using 8 variables (one by column), brought me about 1,330,000 cases of interest.
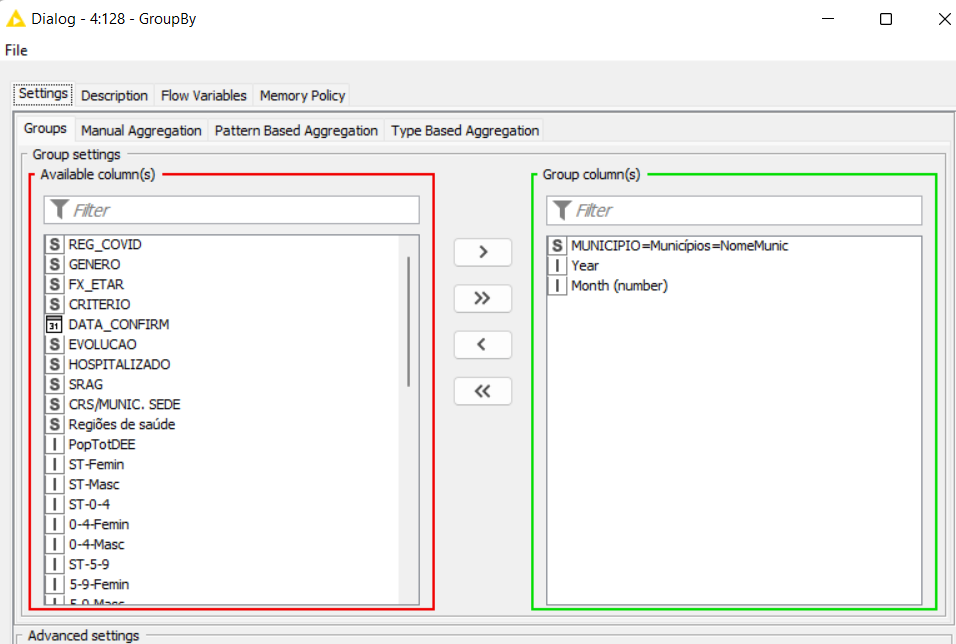
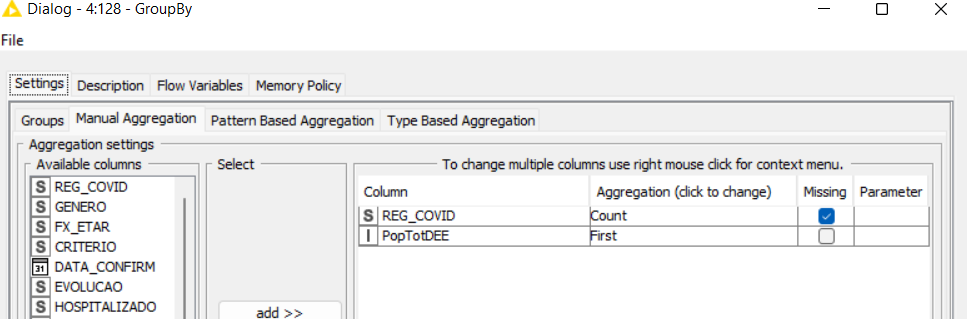
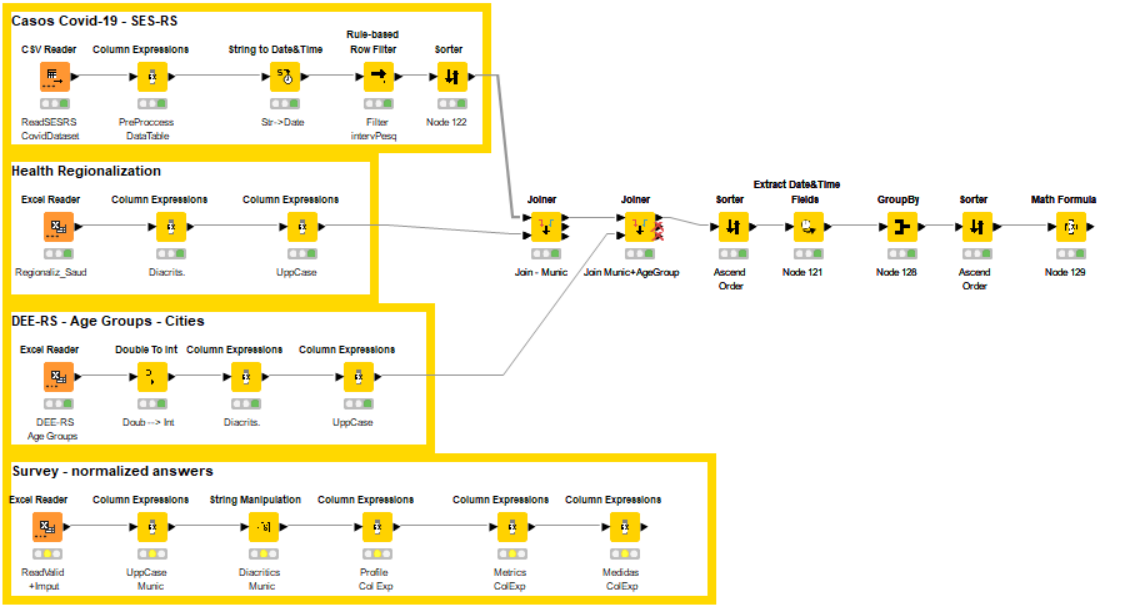
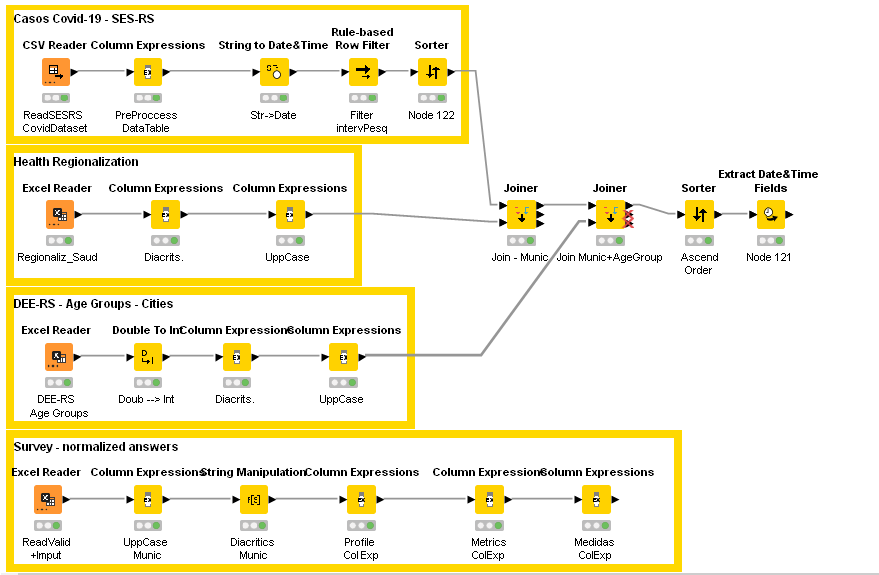
I wrote the following Knime workflow (uploaded and image) for preprocessing data:
< KNIME_project12.knwf (79.7 KB) >
<
2- I used additional open datasets (XLXS) with other data (such as population age groups and regionalization of public health administration) for every specific city:
< RS-RegioesMacrorregioesSaude.xlsx (32.6 KB) >
< recalc-DEE-RS_populacao-municipio-sexo-fx-etaria-2020.xlsx (136.9 KB) >;
3- a file (XLXS) with a sample of results in a survey made with small businesses, containing 8 metrics for their customers and financial inflow/outflow. These metrics have normalized data for 16 months. This survey was applied by Google Forms, and the results were sent to me with 1 column by month for each metric. The file is:
< Anonim+Input+Valid - Respostas survey e dados Munic.xlsx (319.0 KB) >;
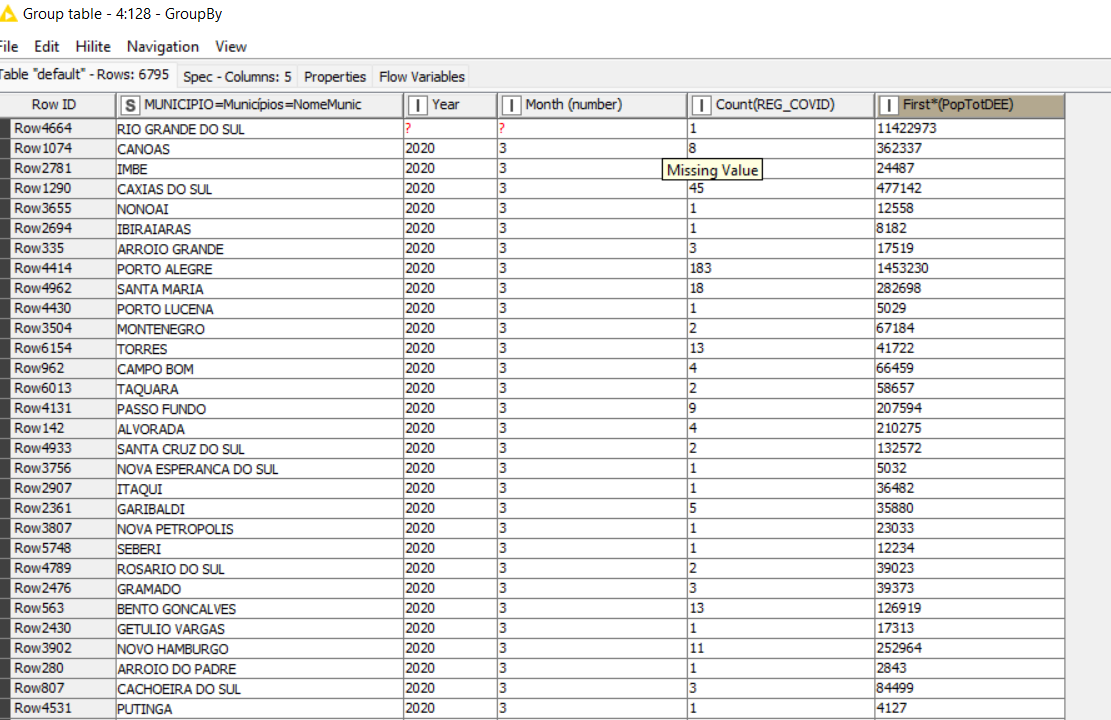
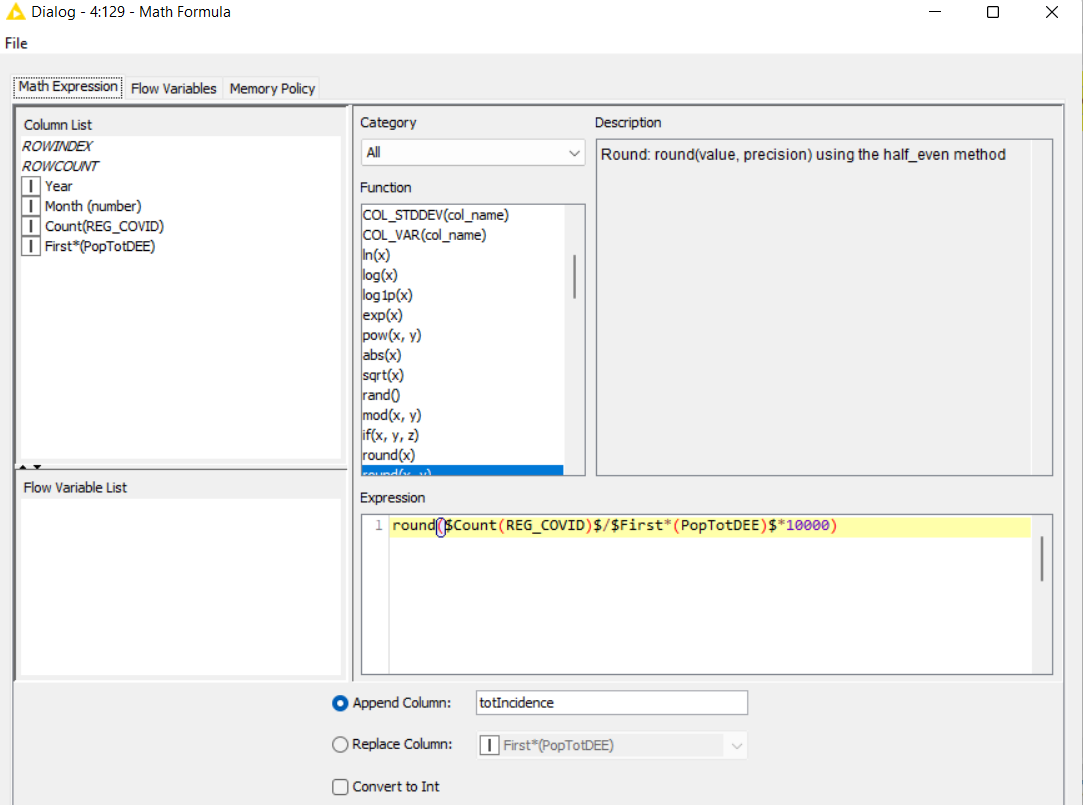
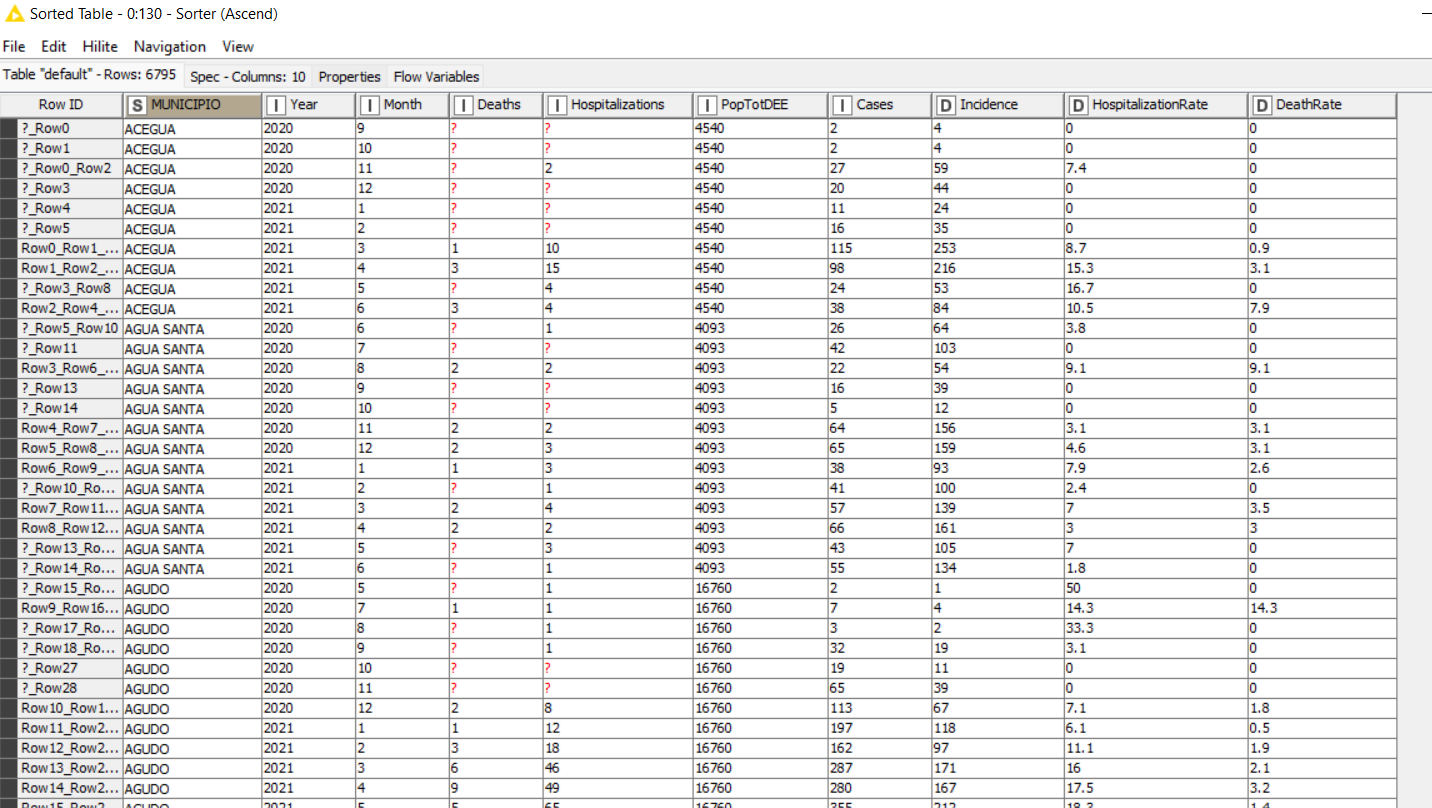
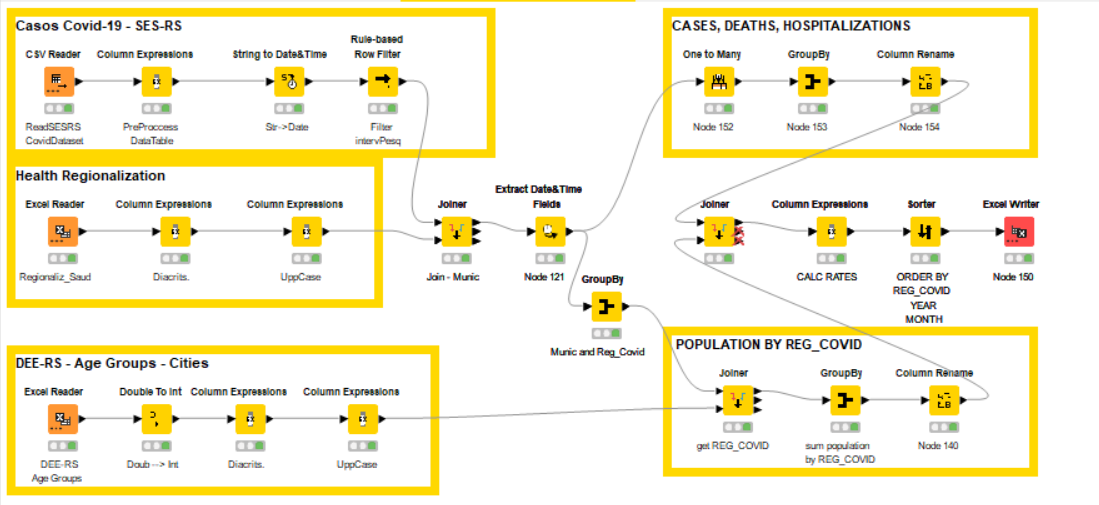
4- I need to compare cities or regions using rates (because of great differences in the number of inhabitants), I plan to use: a) monthly incidence (= (number of monthly new cases) / 10.000 inhab. (to evaluate dissemination); b) monthly hospitalization rates (number of monthly new cases) that lead to patient hospitalization (to evaluate severity); and c) lethality rates (number of monthly new cases) that lead to death. Can someone help with these calculations?
5- I wish also to compare both timelines: a) Covid’s vs b) my Survey results, searching for correlations between two time series, suggesting the possible influence of pandemics on business metrics (with or without lags between increases or decreases on Covid dissemination and severity of cases).
6- considering that: a) original data are not in English (they are in Portuguese(BR)), and b) my files are also in Portuguese, I wrote this additional DOCX file for translating variables and applied terminology:
< Terminology for columns headers - Covid Knime Project.docx (18.8 KB) >.
Can someone help me on comparing these two time series?
Thanks in advance.
Rogério.