Dear Knimers,
I have the following situation to solve, and I ask for your help:
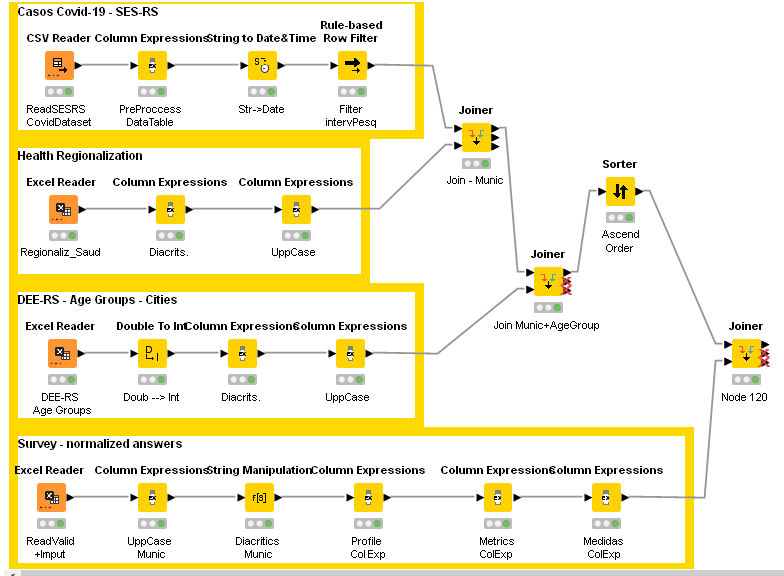
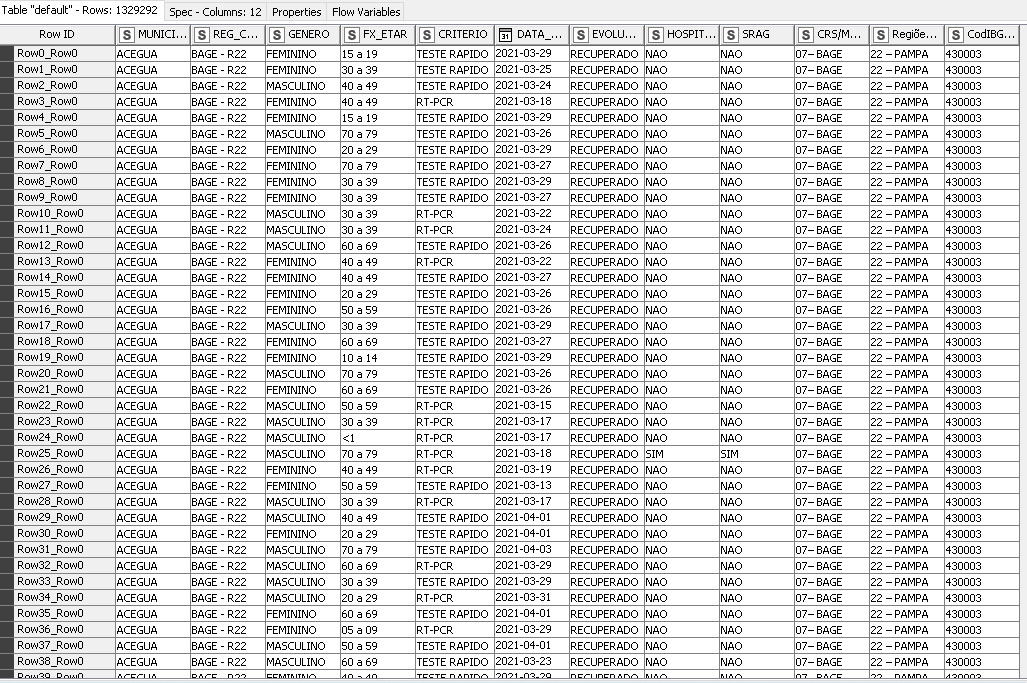
On the one hand, I have a monthly database with registers of COVID-19 cases (1 case by row) in our State (RS, Brazil), with:
a) a few (9) selected columns (gender, age groups, city, severity of cases (recovery OR death, etc.);
b) selected rows for the period of my research interest.
The workflow (for preparing data) is as shown below: KNIME_project9.knwf (93.5 KB)
Considering biggest highly differ very much one from another, in order to compare these citites, what I need is to calculate Covid cases or severity by their rates:
incidence of new cases by month / local population;
Hospitalization rates (as % leading to severe cases by city); and
lethality rates (also as % of cases leading to death by city). Can anyone help me on configuring nodes such as Math Formula? Or another better suited node?
On the other hand, I have a file with the answers to a survey made on local businesses, evaluating a few selected monthly metrics for customers movement in these businesses.
My real goal is to compare general Covid data with inflow/outflow metrics of a specific local/regional industry, month by month, to investigate if the pandemics had (or not) discouraged ordinary customers to search for this particular kind of business.
I thought a few possible working lines, including Pivoting and/or/Unpivoting nodes, or GroupBy nodes, but reached to go no longer with them.
Can someone help me, shedding some light on how to work with these data and my research goals?
Sorry, I thought the workflow was already into an executed state (green lights on the bottom of nodes). I executed it and clicked on “File” and then on “Export KNIME Workflow”, which allowed me to save the workflow as knwf file, which I uploaded on this chat. Can you, please, teach me what are the needed steps for doing what you asked me to?
I corrected some errors and updated the former version of my workflow on: KNIME_project11.knwf (81.6 KB)
As you asked me for datasets, the files originally used are:
a file to Regionalization of Health Administration in: [RS-RegioesMacrorregioesSaude.xlsx|attachment] (upload://m54DkWeS3khPfZPX4JacZEqMrBr.xlsx) (32.6 KB)
In order to get the rates (incidence; hospitalization; severity; lethality). I thought I could use “Value Counter” and “Math Formula”, but didn’t reach how to configure the nodes. By the way, for:
Incidence (I): it is the count of new cases (say “K”) into a period, divided by a fixed number (in my cases, I = K / 10.000), in order to change the absolute number of cases in different places (with different populations) into comparable rates;
Hospitalization rate in a month: (count of registered hospitalizations / count of new cases) x 100%
Severity rate in a month: (count of SARS registered cases / count of new cases) x 100%
Lethality rate in a month: (count of deaths (due to COVID) / count of new cases) x 100%
for “local population”, I considered municipality data, what I had from a downloaded file. If I identify any larger group as relevant by means of my analysis (=clusters), I could have its population summing municipal data of the cities integrating these clusters.
As our State has almost 500 cities, my research goal included clusterization. So I thought Region could be an acceptable candidate for clusters. I wish to compare (with or without a lag between) the economic impacts of Covid dissemination and its severity (in cities that belong to a cluster) on the local business of any respondents of this cluster. This is actually the primary goal of my research. I made a few trials for joining the above blocks of nodes but I could not build a workflow to investigate associations between and
Hi @rogerius1st ,
sorry for the late reply. I am currently working on a project of my own, so I’m a little bit busy too. I think for your case, you should start with transforming your data to a pivot table. Once transformed, it’s easier to do calculations, since you have many variables involved. Doing it one by one is doable, but inefficient. Unfortunately I can’t help transform the table for you at the moment, I hope others will lend a hand.
FYI, whenever you export a workflow in KNIME, by default it’s exported without execution despite being executed prior to exporting. During the time of exporting, you’ll have to untick the box that says reset workflow.
Also, I wasn’t asking for the dataset, but a subset of the data, just enough to represent the patterns of the original dataset, something to work with to assist you better. I wasn’t busy during the time I replied to you the other day
Thanks, @badger101, from now on, whenever I share a workflow, seeking any help on solving my problems, I’ll remember to uncheck the box for resetting the workflow (and its nodes) before exporting it.
And you helped me a lot on my way to finding a consistent approach to my research with those data.
Although I got (a little) sad about losing your essential help, on the other side, it’s excellent to read you’re busy working on a substantial project.
I wish you all the best.
P.S.: on my master’s thesis, I wish to publically thank all people who had helped me with such a task. If you accept, of course, do you authorize me? How should I cite your name?
Hi again @rogerius1st , at the moment I’m taking a short break. Have you figured out how to transform your data to a pivot table? I saw your other post and I’m guessing you’ve received help there already.
Regarding the appreciative citation, I’ll have to pass cause I didn’t help much, but I appreciate you asking.