could you please share with us the catalina and localhost logs for the relevant date as well as specify approximate time frame, when the incident occurred? You can download the full archive of logs via the Admin WebPortal or pull individual ones from the machine directly from <server_installation>/apache-tomee-*/logs/.
The high CPU moments that you have mentioned coincide with KNIME Server reboot. Could it be that you have a set of very CPU intense workflows running, which pump the CPU utilisation and your machine automatically kills the process that consumes most CPU?
side remark, i also see that you have executor dying because of not being able to allocate memory (because you promise it up to 22 GB, but apparently at that moment there is no free space on the system left, but the max of 22 GB is not reached yet.) I suggest that you either adjust the max RAM on the executor or on the machine or amount of data processed in the workflows that run at that time.
my comment was not that 22G is not enough, but that it is too much, as you seem to run some other memory-demanding application in parallel and your machine does not have enough memory to fit all running processes. The maximum RAM is the max amount of memory, that JVM can occupy and it is controlled by the -Xmx parameter in knime.ini of the executor.
Is there a way to check when such kill protocol was issued? If yes, could you please find out times on the 17th and the 18th and we can compare those to the logged server reboots.
Percentage of CPU utilization depends on what workflows do you run, what are your machine specs and on what are other processes running in parallel with the server. We can not comment on it - only the user and the machine admins know what is going on.
Indeed, that’s a good idea. Just to be 100% sure: how do you make sure that the execution windows do not overlap, i.e. workflows can take very different time to finish depending on the workflow structure and on the input data.
i know its good but… knime supposed to play role in both ways…
i guess i found isseu -
swap memory not freeing after workflow execution done , even after closing knime. - i need to reboot for this…
every ttime i check swape memory is above 85%
then i reboot machine then it come back to normal and jobs run fine…
but after many job execution again swap memory above 85%
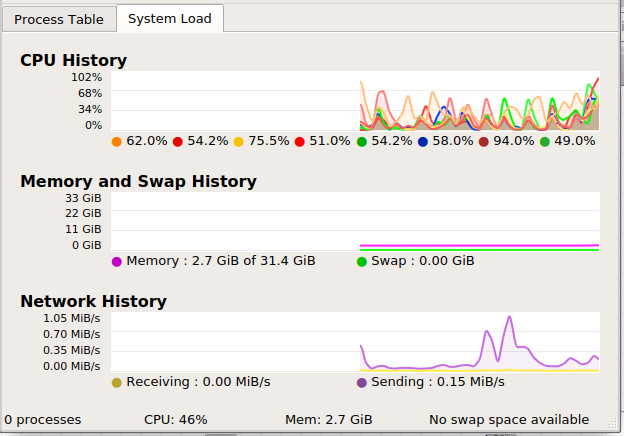
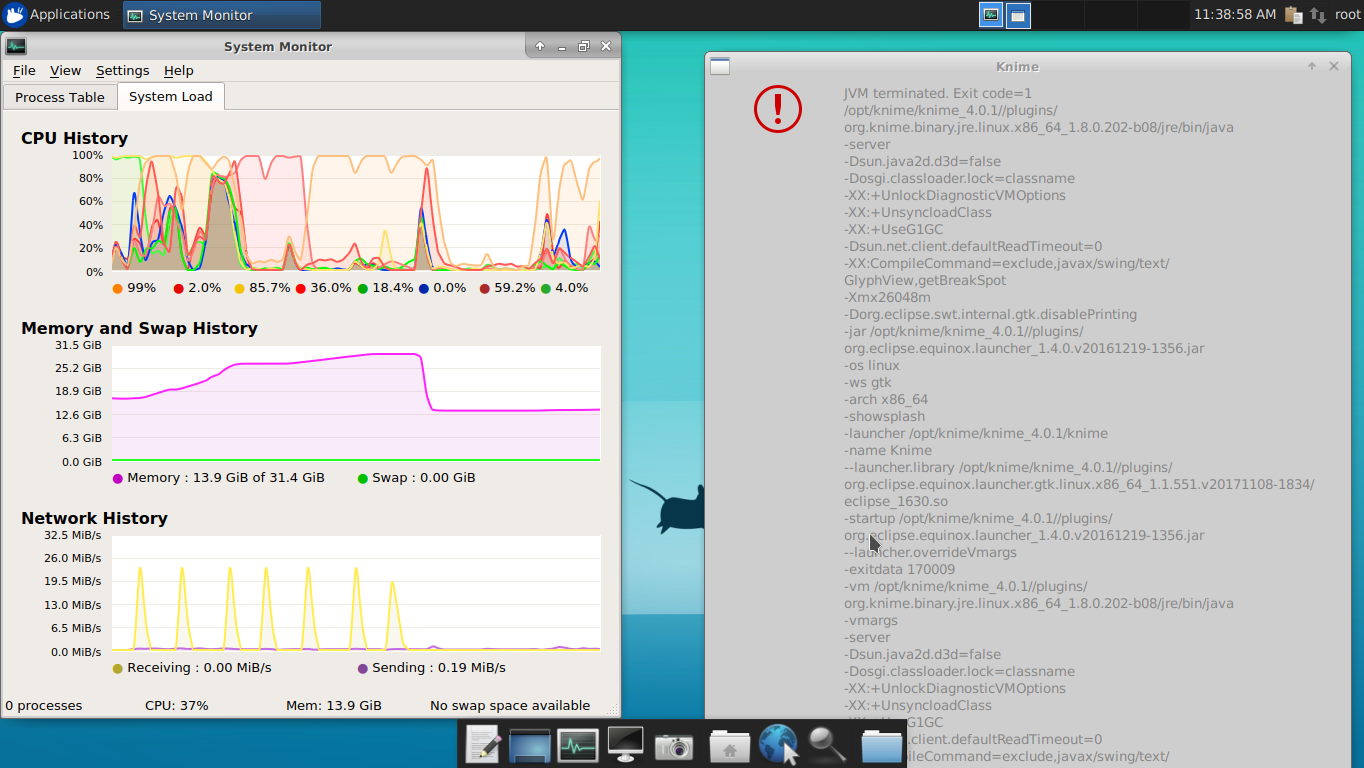
thanks for further details the screenshots are particularly useful to get insights into the situation. The first screenshot from yesterday shows memory usage at ~2.5GB, which is not very insightful, as you have pointed out. But the screenshot from today looks very interesting. It indeed shows that you hit the memory limit on your machine. However, i do not see swap memory at above 85% but rather the virtual memory. Is that what you have meant in this comment? In this screenshot you see a sharp cut-off in the memory footprint. This happens, when the executor crashes, as it tries to allocate memory up to the limit that you specified with Xmx argument in the knime.ini (22GB, if i remember right) and fails to do so, because there is no enough memory on the machine. This seems to happens, because you have some other processes occupying ~12.6 GB of virtual memory in total. 32-12.6 < 22. Could you comment on what is the situation in which the previous? Have you restarted the server by then and there is another workflow running or is the previous situation kept as is? The two last screenshots were posted separated by 30 min in time and it is not clear what happens in between.
In general,you need to understand what eats into the memory and competes wit hthe server for memory resources. Note, that you should not expect the executor to release memory back to the system while the executor is up. It runs in a JVM and has internal memory management and will release memory only upon closer. Quick googling gives sevral discussion threads, and this comment seems to be a good a simple summary: Reset/Free WF memory
At this stage, while you investigate what else eats into ,memory i suggest that you reduce the maximum memory available to the executor to avoid executor crashes.