Dynamic Filter connected to several Python Views of a dashboard

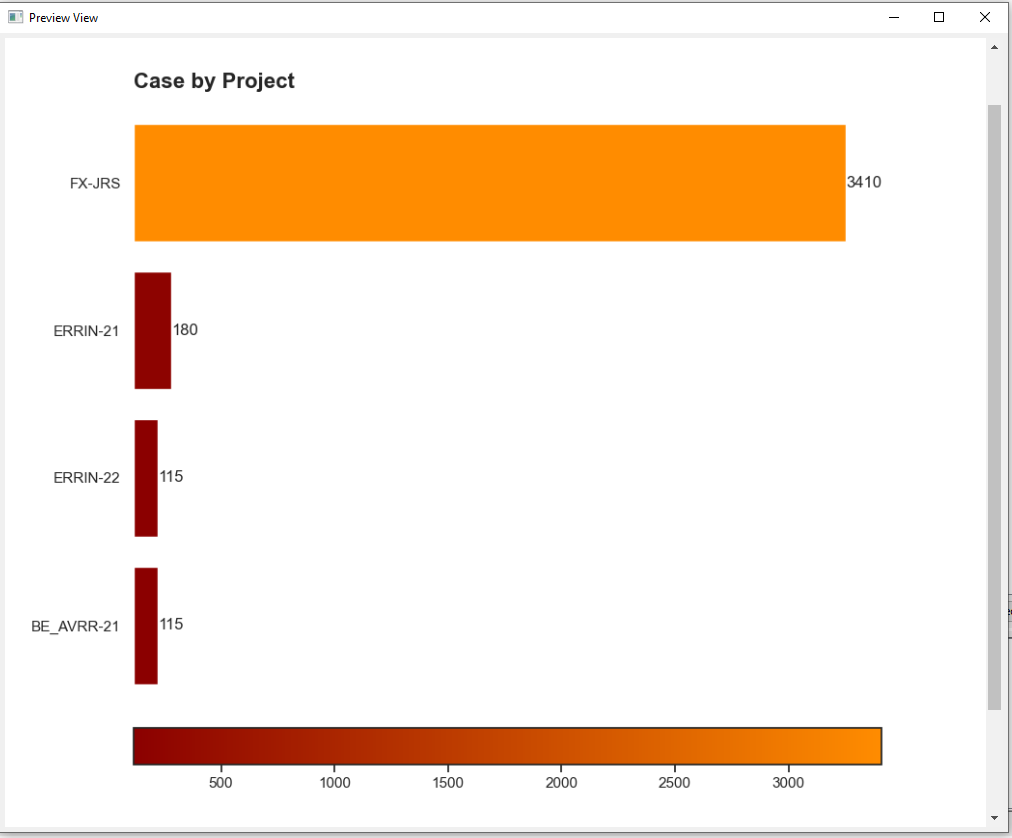
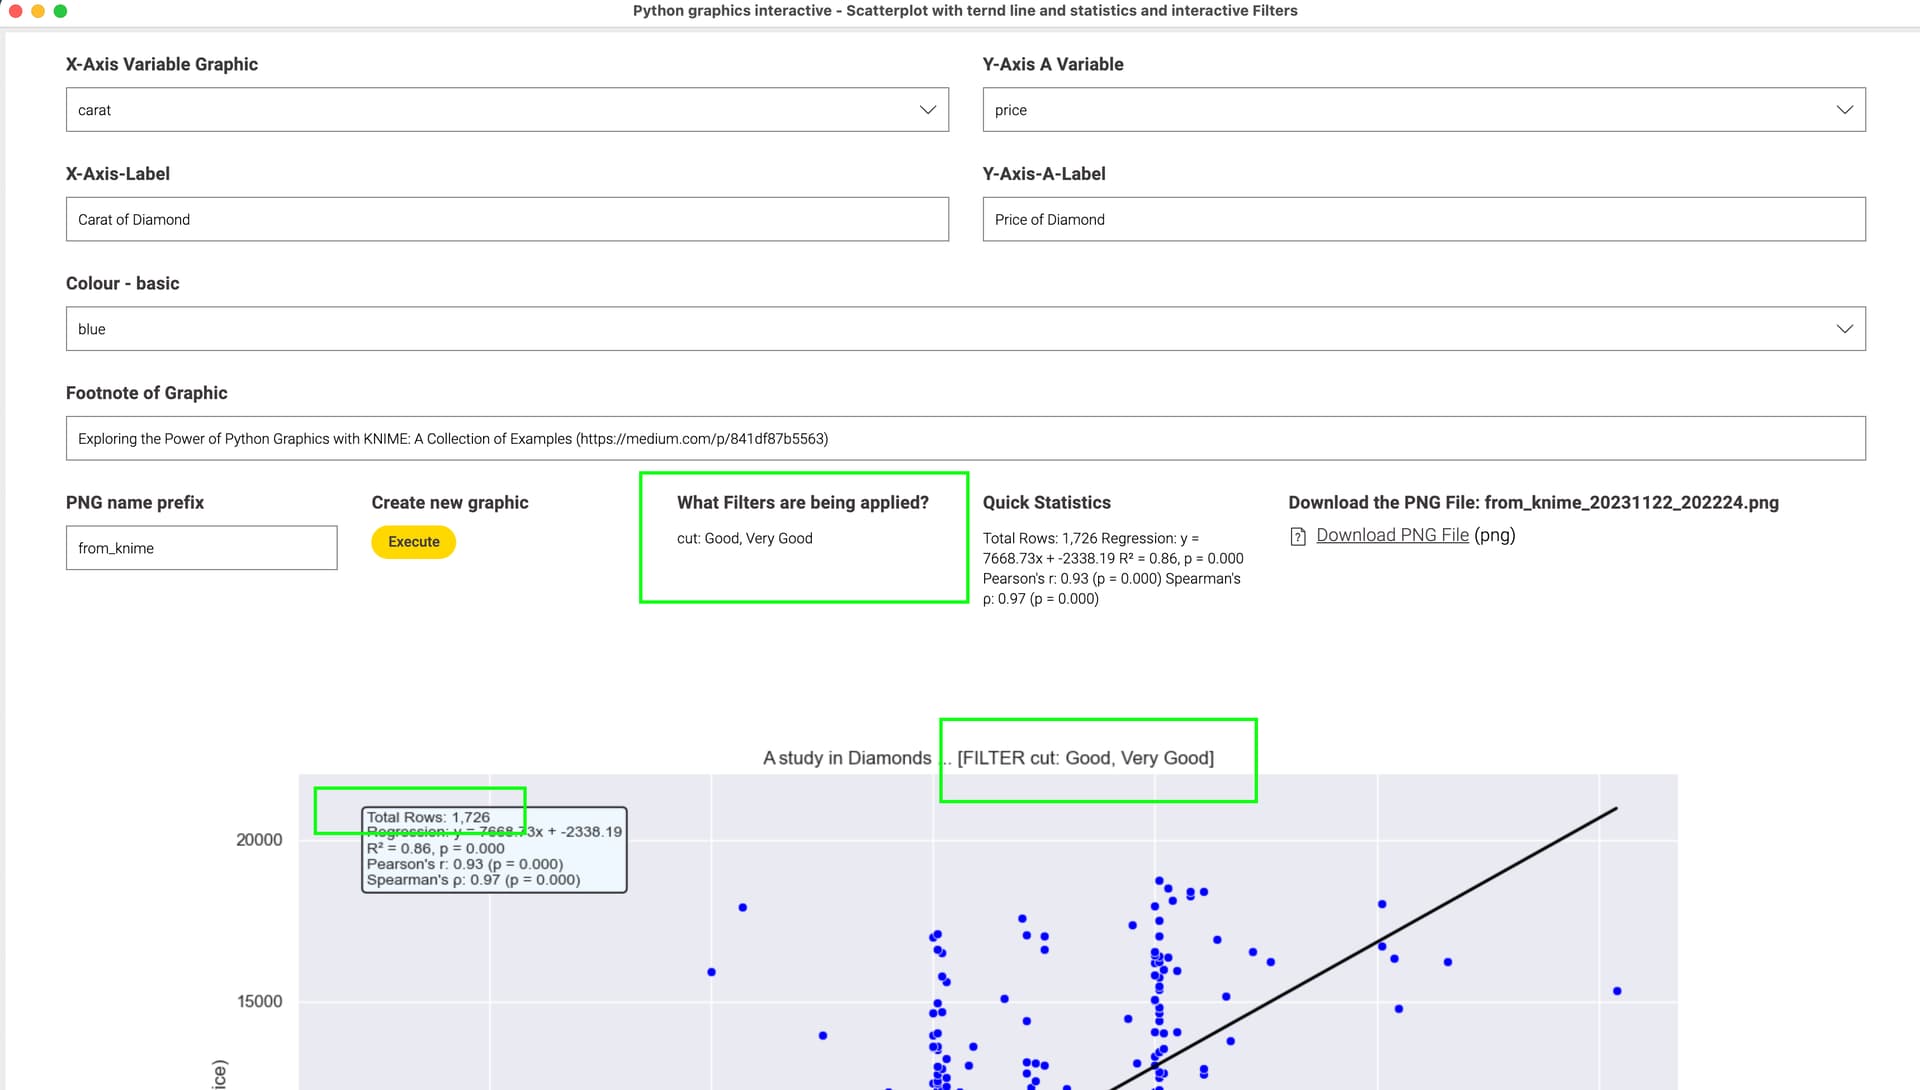
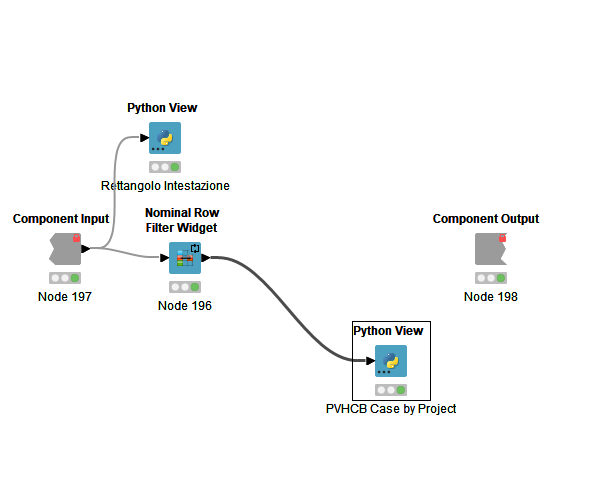
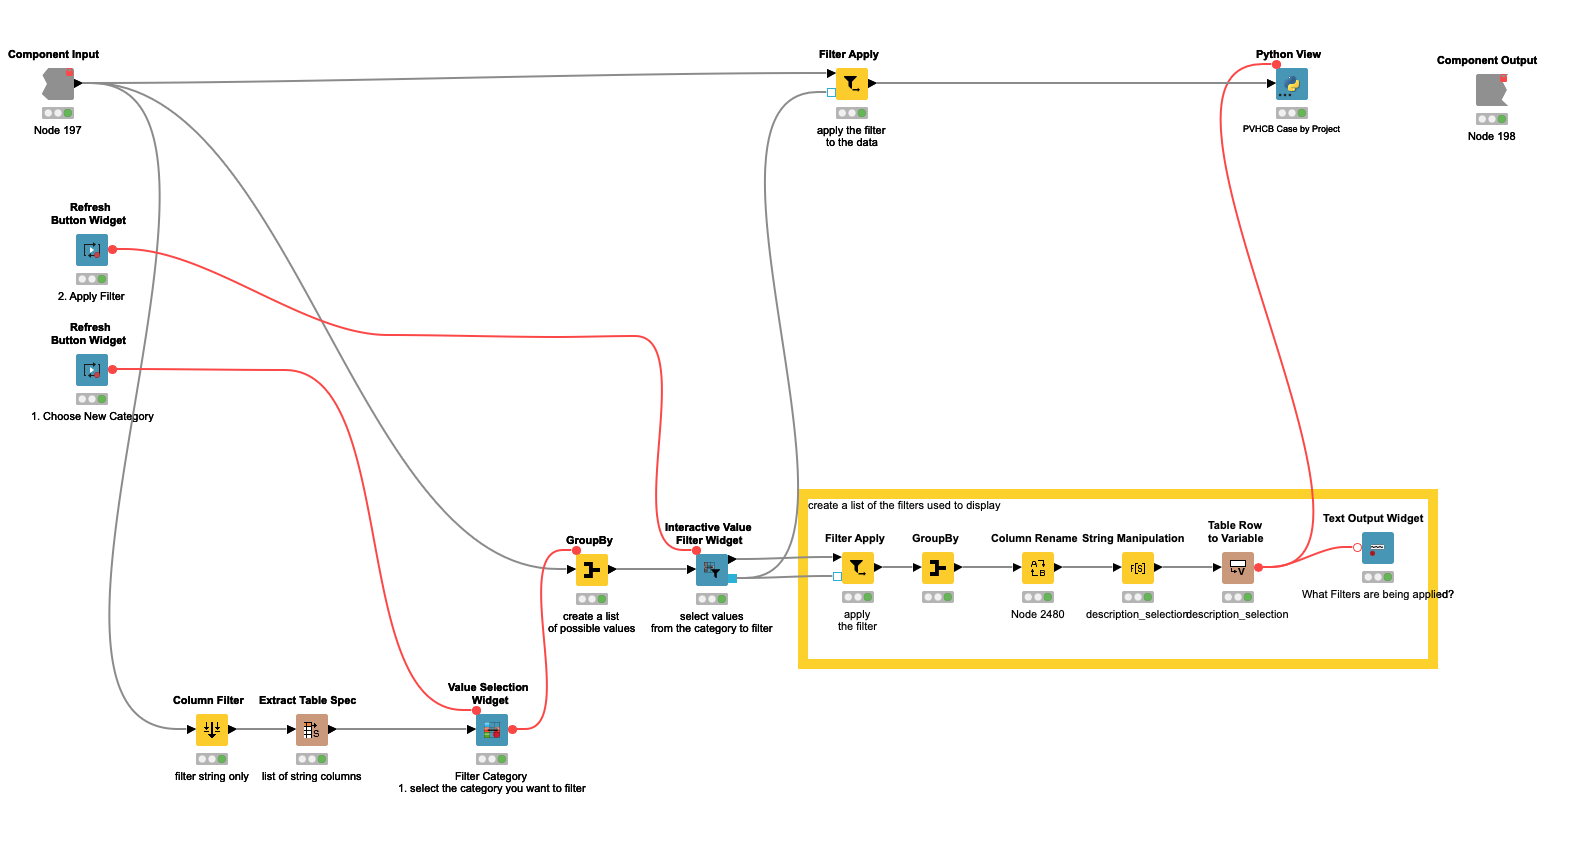
I made the following dashboard test, for reproducing on KNIME an interactive dashboard, previously made in PowerBI. I had to use several PythonView charts (this because for my managers the KNIME standard chart available for barchart, pie-charts and similar, was judged not nice and with too limitations for the customization). Now I need to add some dynamic filters. The candidates widget objects for that are: Value Selection Widget and Nominal Row Filter Widget. Here the problematics that I have with these 2 objetcs:

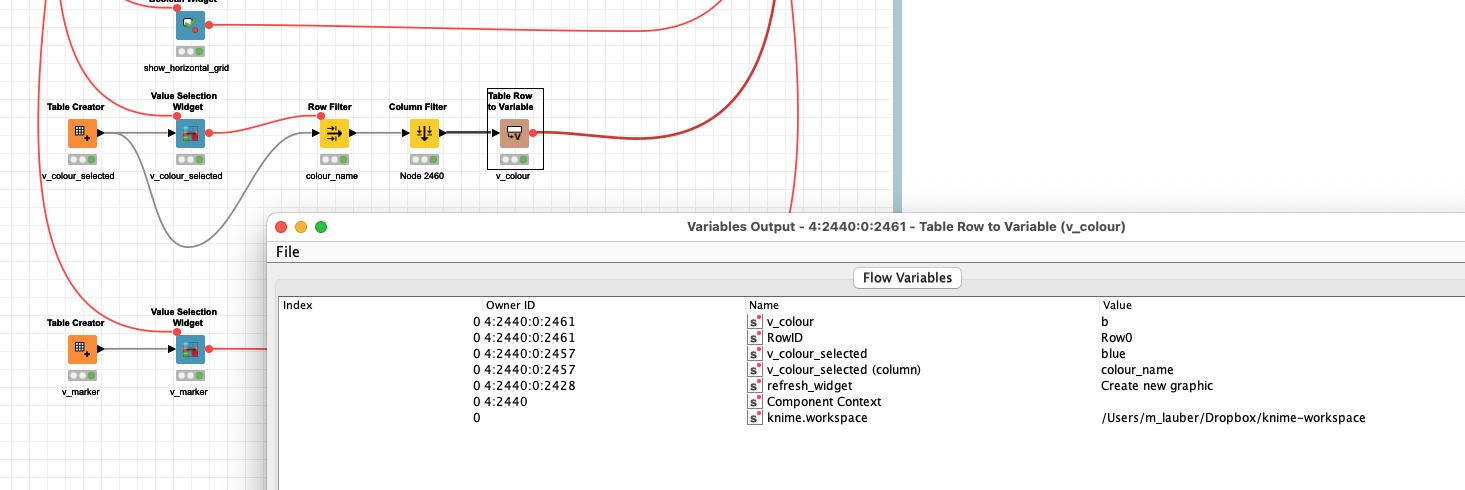
  • Value Selection Widget: It appears to run correctly with the Pyton View chart, but for this widget is mandatory to define a default value. The problem is this default value to impose, because when we enter we would that in the dashboard we can see all the data, without applying a filter. After we could, select from the dynamic filter (in this case Value Selection Widget) one item of a column called PROJECT_CODE for having the detail of this code project. I tried to add a fake value ‘All’ on this column for having all the values via a Python script, but this added line is not recognized after from the node Value Selection Widget. Have you some idea about a workaround for overcoming this limitation?

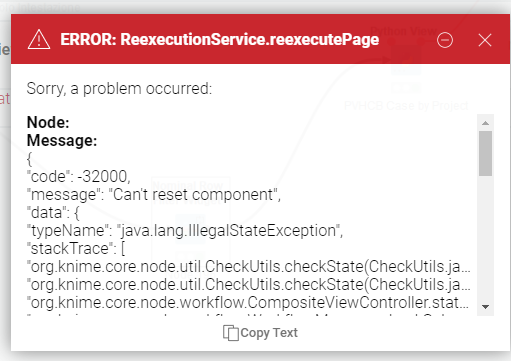
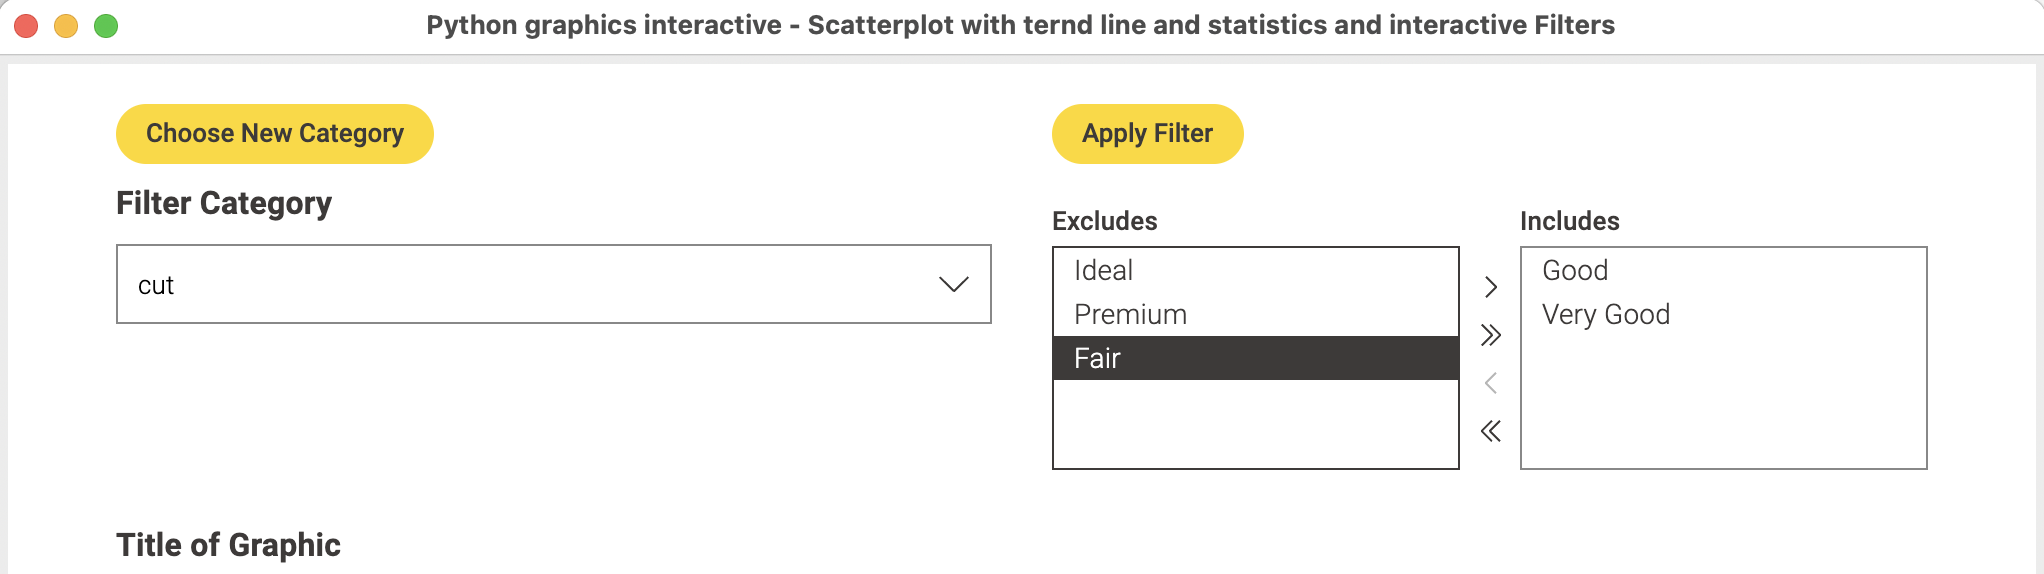
  • Nominal Row Widget: , it has no necessity to define a opredefined value , but, A part the fact that I have to transform the column project data selected in an array of list type (without this conversion the dataframe used in the node PythonView is considered empty), I was constrained also to add, between the Nominal Row Widget and the Python View, an object Nominal Row Filter. But when I launch this dashboard with Nominal Row Widget, I have al the data on the dashboard, but when I select one of project I have the folowing error “but several times i Have this error: Node:
    Message: {
    “code”: -32000,
    “message”: “Can’t reset component”,
    “data”: {
    “typeName”: “java.lang.IllegalStateException”,
    “stackTrace”: [
    “org.knime.core.node.util.CheckUtils.checkState(CheckUtils.java:265)”,
    “org.knime.core.node.util.CheckUtils.checkState(CheckUtils.java:164)”,
    “org.knime.core.node.workflow.CompositeViewController.stateCheckWhenApplyingViewValues(CompositeViewController.java:215)”,” but after it shows the data of the project selected. Where is the error? Have you some workaround for overcoming these problems? Or some solution for these problems?
    Here attached an idea of the dashboard where I have to add this Dynamic Filters
    KNIME_EMNIES_Dashboard_Cases_Overview_v2.pdf (584.2 KB)

PS: Would be possible to avoid to have a Default Value on the Value Selection Widget? ERRATA CORRIGE: I want to say Nominal Row Filter Widget (not Nominal Row Widget) in the header of second item of this list of explanations.

Maybe have to consider to use the nodes Python View or Python Script for creating these dynamic filter and after connecting these nodes to the Python View Charts? then insert these Dynamic filters so built on the KNIME dashboard? Do we have not the risk that after the dashboard becomes difficult to manage?

@DanGenEire I see these option basically.

You can make a case distinction and if your value says “All” you select a path that would not include any filters.

Another option could be to make some sort of reference where you will display something else and then put that into a filter:

All - “>0”
REG12 - “=1”
REG13 - “=2”

Maybe not the most elegant way but it should work

In this example the displayed colour in the widget is “blue” but the value submitted is “b”

Also the angle is displayed as strings (words) but the it is being ‘translated’ into a number within the Python node.

Maybe you can provide a sample to play with containing some dummy data.

1 Like

@DanGenEire as an addition you could try this widget

I tried this last, but we have a problem because it needs that the column value from a dataframe (where the data come from a DB ORACLE) was transformed in a list type, but when we lunch the dashboard after we have several error yet described in fist message, also if after , shows for the project selected the value waited. I will provide soon the original code behind the Python View chart and I try to create a sample.

Hi here the Python code of one of chart Python View which should use the dynamic Filter (here I REMmed my tests with both object: Nominal Row Filter Widget and Value selection Widget) :

import knime.scripting.io as knio
import pandas as pd
import numpy as np
import matplotlib.pyplot as plt
import seaborn as sns
from matplotlib.colors import LinearSegmentedColormap
from matplotlib.cm import ScalarMappable
import matplotlib
matplotlib.use(“TkAgg”)

sns.set()

#selected_project = list(knio.flow_variables[‘value-selection’])
#selected_values = knio.flow_variables[‘value-filter’]

data = knio.input_tables[0].to_pandas()
df_sorted=data.sort_values(by=“Sum(TM Total Cases KM-Exclusive NOT DISTINCT)”, ascending=True)

Apply filter base on the value selected

#df_sorted=data[df_sorted[‘PROJECT_CODE’] == selected_project]
#filtered_data = data[df_sorted[‘PROJECT_CODE’].isin(selected_values)]

fig, ax = plt.subplots(figsize=(10,10))
sns.set_style(‘white’)

Define a custom colormap from dark blue to dark red

colors = [‘darkred’,‘darkorange’]

custom_cmap = LinearSegmentedColormap.from_list(‘darkred_to_darkorange’, colors, N=256)

Normalize the data to map it to the custom colormap

normalize = plt.Normalize(vmin=df_sorted[“Sum(TM Total Cases KM-Exclusive NOT DISTINCT)”].min(),
vmax=df_sorted[“Sum(TM Total Cases KM-Exclusive NOT DISTINCT)”].max())

bars = plt.barh(
y=df_sorted[“PROJECT_CODE”],
width=df_sorted[“Sum(TM Total Cases KM-Exclusive NOT DISTINCT)”],
color=custom_cmap(normalize(df_sorted[“Sum(TM Total Cases KM-Exclusive NOT DISTINCT)”])),
)

plt.title(“Case by Project”, fontsize=16, fontweight=‘bold’, loc=‘left’) # Set font size, weight, and position
plt.grid(False)

plt.yticks(df_sorted[“PROJECT_CODE”])

Add value annotations over the bars

for barh, value in zip(bars, df_sorted[“Sum(TM Total Cases KM-Exclusive NOT DISTINCT)”]):
plt.text(barh.get_x() + barh.get_width() + 1.5, barh.get_y() + barh.get_height() / 2, f’{value}', ha=‘left’,
va=‘center’)

Hide x-axis labels

plt.xticks()

Add a color scale

cbar = plt.colorbar(plt.cm.ScalarMappable(cmap=custom_cmap, norm=normalize), ax=ax, orientation=‘horizontal’, pad=0.02)

ax.set_facecolor(‘white’)

Assign the figure to the output_view variable

#knio.output_view = knio.view(fig)
knio.output_view = knio.view(plt.gcf())

this correspond at this chart:

@DanGenEire what would be good is a complete workflow example and a code that is formatted in a readable way or add it as a file.

image

import pandas as pd
import numpy as np

I will see if I can come up with an example later.

Hi @mlauber71, her is attached the code of the Python View as text: I hope that it can helps.

Code_Python_View_Cases_by_project_EMNIES.txt (3.3 KB)

I am creating a simplified workflow with the object for the filter and with one chart with Python View.

This a simplified workflow where I try to use Nominal Filter Widget:

But after every time that I select I have the same error: Node:
Message: {
“code”: -32000,
“message”: “Can’t reset component”,
“data”: {
“typeName”: “java.lang.IllegalStateException”,
“stackTrace”: [
“org.knime.core.node.util.CheckUtils.checkState(CheckUtils.java:265)”,
“org.knime.core.node.util.CheckUtils.checkState(CheckUtils.java:164)”,
“org.knime.core.node.workflow.CompositeViewController.stateCheckWhenApplyingViewValues(CompositeViewController.java:215)”,
“org.knime.core.node.workflow.WorkflowManager.checkSubnodeForViewUpdate(WorkflowManager.java:5293)”,
“org.knime.core.node.workflow.WorkflowManager.resetSubnodeForViewUpdate(WorkflowManager.java:5282)”,
“org.knime.core.node.workflow.WebResourceController.loadValuesIntoPageInternal(WebResourceController.java:216)”,
“org.knime.core.node.workflow.CompositeViewController.loadValuesIntoPage(CompositeViewController.java:162)”,
“org.knime.core.node.workflow.CompositeViewController.reexecuteSinglePage(CompositeViewController.java:264)”,
“org.knime.core.wizard.CompositeViewPageManager.applyPartialValuesAndReexecute(CompositeViewPageManager.java:247)”,
“org.knime.core.wizard.rpc.DefaultReexecutionService.reexecutePage(DefaultReexecutionService.java:136)”,
“java.base/jdk.internal.reflect.NativeMethodAccessorImpl.invoke0(Native Method)”,
“java.base/jdk.internal.reflect.NativeMethodAccessorImpl.invoke(Unknown Source)”,
“java.base/jdk.internal.reflect.DelegatingMethodAccessorImpl.invoke(Unknown Source)”,
“java.base/java.lang.reflect.Method.invoke(Unknown Source)”,
“com.googlecode.jsonrpc4j.JsonRpcBasicServer.invoke(JsonRpcBasicServer.java:478)”,
“com.googlecode.jsonrpc4j.JsonRpcBasicServer.handleObject(JsonRpcBasicServer.java:349)”,
“com.googlecode.jsonrpc4j.JsonRpcBasicServer.handleJsonNodeRequest(JsonRpcBasicServer.java:274)”,
“com.googlecode.jsonrpc4j.JsonRpcBasicServer.handleRequest(JsonRpcBasicServer.java:242)”,
“org.knime.core.webui.data.rpc.json.impl.JsonRpcServer.handleRequest(JsonRpcServer.java:150)”,
“org.knime.core.wizard.rpc.JsonRpcFunction.call(JsonRpcFunction.java:175)”,
“com.equo.comm.chromium.service.provider.ChromiumEventHandler.receiveMessage(ChromiumEventHandler.java:223)”,
“com.equo.comm.chromium.provider.CommunicationManagerChromiumImpl.receiveMessage(CommunicationManagerChromiumImpl.java:42)”,
“com.equo.chromium.swt.internal.spi.CommRouterHandler.lambda$0(CommRouterHandler.java:36)”,
“java.base/java.util.concurrent.ThreadPoolExecutor.runWorker(Unknown Source)”,
“java.base/java.util.concurrent.ThreadPoolExecutor$Worker.run(Unknown Source)”,
“java.base/java.lang.Thread.run(Unknown Source)”
]
}
}

image

For Value Selection I added before a Python Script for adding a Value ‘All’ but it appears ignored:

In this image we have the workflow before the dashboard worflow, hoping that it can help:


NB: the data are taken directly from an Oracle DB

@DanGenEire if you could actually provide the workflow that would be great

TEST 3 Dashboard APPS DynFilters Simplyfied.knwf (162.1 KB)
Hi, @mlauber71
I hope that I well understood , here the workflow simplified, exported, I hope that could help you for founding a solution.
For me could be OK (maybe also better) the Value Selection Widget, if we found a possibility to see All the projects when someone can connect, moreover that the detail of the project chosen, and also to go back to having all projects after having saw the project detail.
Also the *Nominal Row Filter Widget * could be OK, if we manage to solve the issue that we have when we try to make a selection of All, one or more project on the dashboard.

A strange behavior using Nominal Row Widget as Twin List (instead of simple list) and a Python View chart in a dashboard: on the KNIME full client it runs without problem and error showing the correct values, but when I launch the same on the server it allows to select from the Twin List without error , but after on the server the chart does not change , it shows always all the projects.

@DanGenEire I tried to build something that should do what you want. It includes three Refresh Buttons.

The component extracts all the numeric columns (for the chart) and all the strings (for the categories to select from)

The first button will refresh the list of options to filter from. In this case if you choose “cut” (of diamonds) it will provide you with the list of options where you can select the ones you want (one or several):

The chart will get updated and the selected filters are being displayed along a total number of rows used (to verify something has changed). The third button is for further adaptions (which numeric variables to display etc.).

What happens inside the component is that the filter is being applied to the dataset and the settings are ‘recorded’ in order to be displayed (you could also save them for later, maybe with a timestamp if you want):

kn_example_python_graphic_scatterplot_diagonal_interactive_filter.knwf (918.7 KB)

@DanGenEire the workflow does not contain any data and it has a lot of data preparations that might not be relevant for this question. From my experience it is best to provide a minimal example possibly with dummy data wich demonstrates the problem (or the solution).

Thanks @mlauber71 I will analyse your sample OK I try to prepare something, more simple with dummy data. Meanwhile also using the radio button I have the same strange behavior that I have with the Twin List.

1 Like

Hi @mlauber, finally I completed a sample minimized of this dashboard:
EC_EMNIES_Dashb_DynFilter.knwf (15.4 KB)
Here I simulated the DBdata with a dataframe created via R-code in a R-Source node and after I linked it to the Nominal Row Filter Widget and the PythonView chart. I verified, and I have here the same problematic on the server portal with radio-button and Twin List and the same error than before for Simple List on full client and on the server. Here the flow and the component minimized:
image
image
I hope that can help you.
Sorry I tried to see your sample but in the EC we are in some inferior version of KNIME not compatible with the workflow that you sent.

@DanGenEire I added my solution as a new component to your example. Although your component also does work on my Apple Silicon machine with KNIME 4.7. So it might also be a problem with versions maybe.

Bildschirmaufnahme 2023-11-23 um 18.15.39

This is how it does work inside the component:

kn_forum_75456_python_component_interactive_filter.knwf (296.2 KB)

edit: this also does work using an R View node

Hi @mlauber71 , Thank you very much. It is interesting your solution, also If I transform in list the Project Filter I do not have errors. But always on the our KNIME server the data visualization on the barchart does not change according to the project selected: it shows always all the data. Is it very curious this behaviour. I wiil speak with the EC DIGIT person people, for trying to have a solution for this visualization issue on the KNIME server.