Has anyone tried calculating earnings/exposure in KNIME?
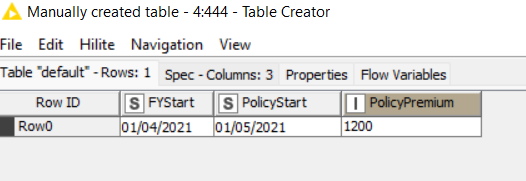
Earnings/Exposure in Insurance is the Premium/Man days attributable to a particular financial year. Suppose the FY begins on April first and a policy with a premium of 1200 units starts on 1st may, the earnings for the current FY is 1100 units and next FY is 100.
I don’t recall this particular topic being posted on the forum before. Do you have a sample dataset and example of how you would do this calculation in other other software? Presumably you are doing this in Excel or Python?
A bit more detail would help us help you, since many here aren’t insurance professionals.
Hi @Harisruta , as @ScottF said, if would be helpful if you explained the calculation or formula to use. I would not know what you are trying to do.
@duristef , I was expecting to see in your results the 100 that @Harisruta mentioned. I think knowing what the calculation should be is critical @Harisruta
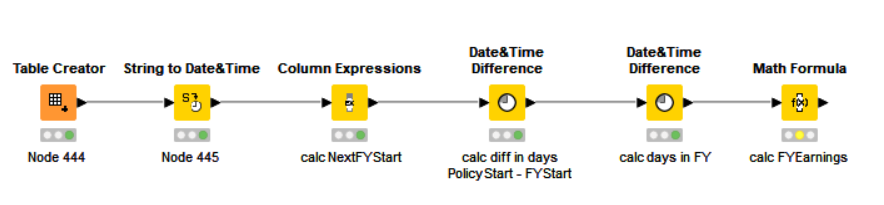
In my interpretation, the premium is split over two FY following this rule:
Policy_diffDays (i.e. days not in FY0) = start of the policy - start of FY0
FYDays (i.e. length of FY0 in days) = start of FY1 - start of FY0
NextFYEarnings (i.e. premium pertaining to FY1) = Policy_diffDays/FYDays * PolicyPremium
FYEarnings (i.e. premium pertaining to FY0) = NextFYEarnings - FYEarnings
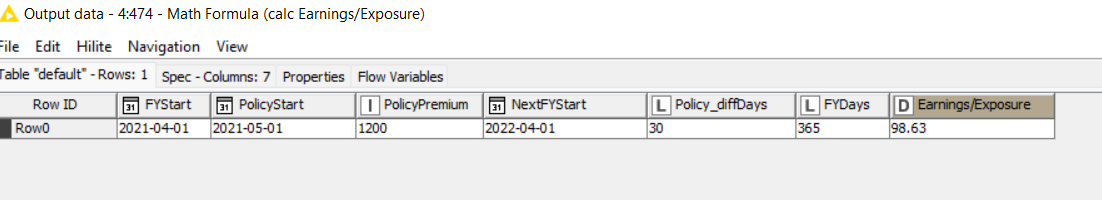
in fact, the label I used is misleading: 98.63 are the earnings pertaining to 2022 and should be called “NextFYEarnings”. The result is not 100 simply because in @Harisruta’s example 1 month = 1/12 year => NextFYEarnings = 1200/12 = 100. I guess it’s a simplification to make the example easier to understand.
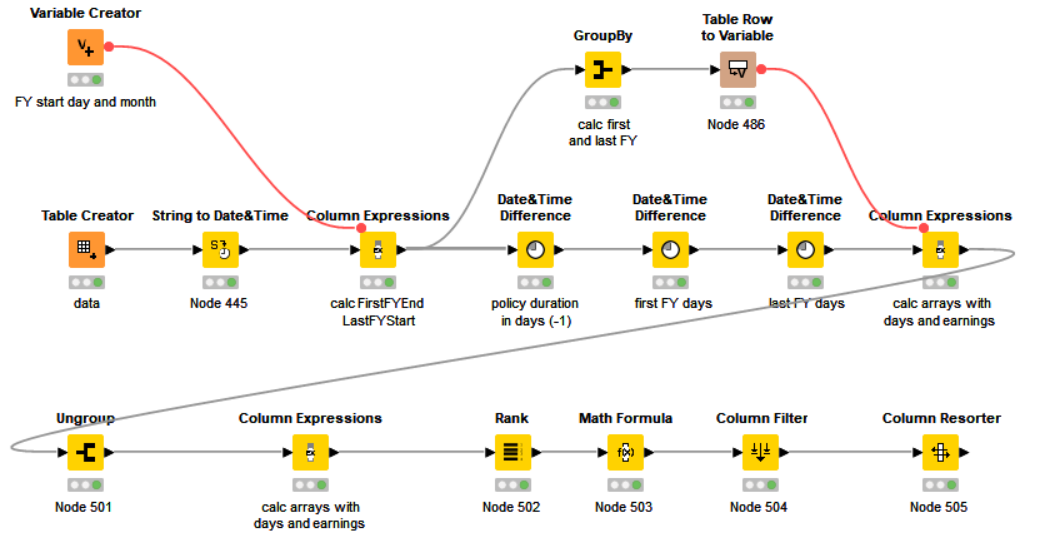
Here’s my complete and hopefully more understandable workflow KNIME_project8.knwf (14.3 KB)
@ScottF , @bruno29a@duristef - Thanks for your replies. Yes, This was over simplified. It should actually work to 31/365 (31 days in May). I understand the nodes used , (Date and time difference, mainly)
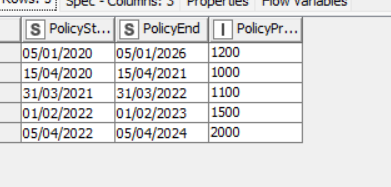
The actual problem arises when it is a historical policy data. There will be policies across different years. We will have to calculate earnings for each year. Suppose the polices are from FY ending 2020 to FY ending 2023. We will have to get a pivot for earnings in all the years as at a particular analysis date.
I have done an excel example and attached the same. The FY starts on 1st April and ends 31st march. Is it possible to get the same in Knime? or can someone pl suggest what all nodes/functions to use?
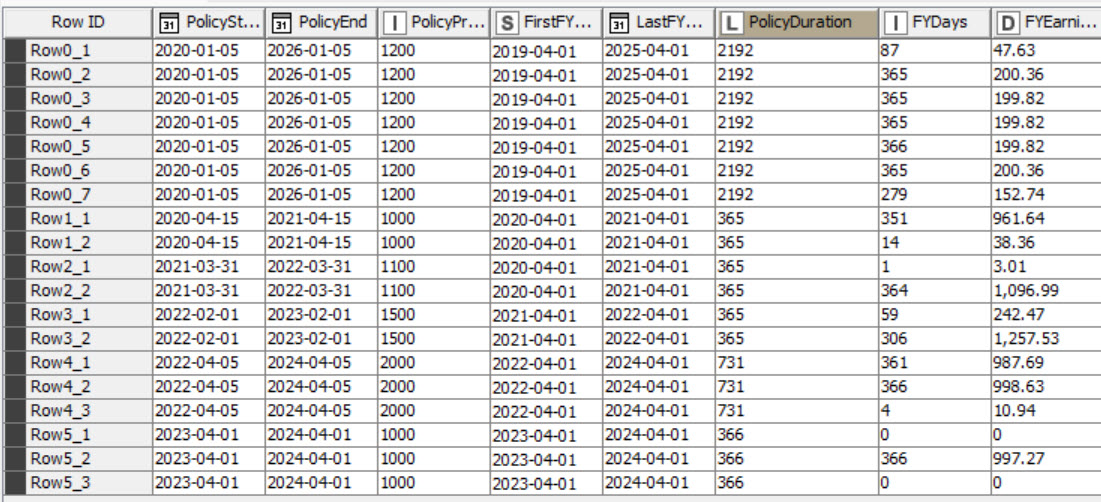
This is the output table. I assume FY starts April 1st. The last two columns contain an array with the duration of the policy isplit by FY and the premium split by FY accordingly.
Everything would be much easier if I could find how to calc date differences within a column expression. The function is probably there somewhere but I can’t seem to find it KNIME_insurance.knwf (21.8 KB)
Though I may need take some time to actually understand working with arrays, I understand what the array is doing. And I think these are the numbers I need. But is it possible to “Extract” these arrays into columns? (Columns are the years they are exposed to- like in the excel) In the end I want to put a summary (a pivot) for earnings in respective years.
KNIME_insurance_rows.knwf (35.8 KB)
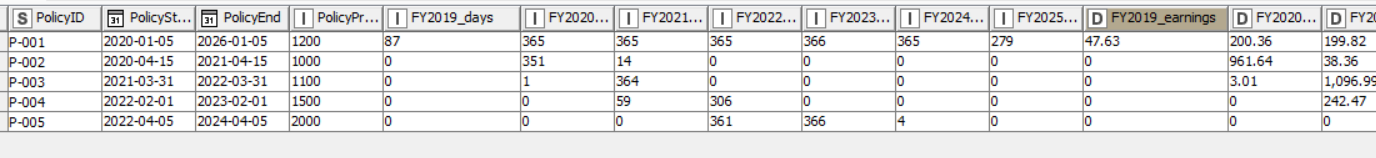
If you prefer a table with one column per year (both for the days and the earnings) my workflow gets more complicated