Hello!
I am new here (1st post) and am in dire need to learn how to:
- Build the right workflows to structure a machine learning model.
- How to deploy the results.
I watch some tutorials but didn’t find the answers I was looking. I would be rather grateful to anyone willing to help me!
Below is the narrative describing the excel file uploaded.
Example for KNIME.xlsx (19.0 KB)
OBJECTIVE
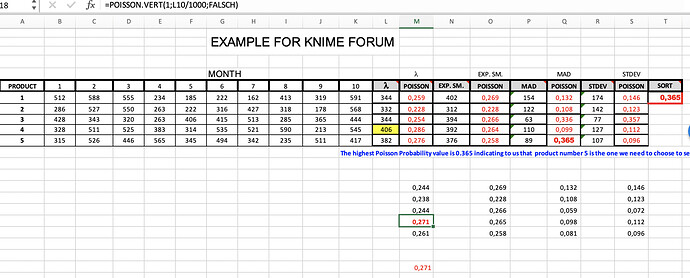
We made the decision to sell one product, only out of the five we currently sell. Thus, we want to establish which is that one product, that is predicted to sell the most according to the highest POISSON Probability value.
This is a small, simple example, and the idea is to establish the mechanics to define the workflows needed, which will be the same procedure to follow with an example involving thousands of rows and many columns. It will also help me devise new, additional workflows when creating other models. It is important to consider that, while the statistical tools were ran and applied to obtain the resulting values depicted (there may be some differences due to rounding), the choice of said tools as well as the results obtained are irrelevant.
THE MODEL
We will work with a 10-day observations analysis.
We will calculate the Poisson value, factoring in what is also referred to as Lambda, specifically as Poisson probability: P(X = x)
STATISTICAL TOOLS
The different POISSON values will depend on the variations of Lambda (same as Mean) and the value of these variations will be established by the forecast and various dispersion tools we will be using apart of Lambda, namely, EXPONENTIAL SMOOTHING, MAD-Mean Absolute Deviation and STDEV-Standard Deviation.
Each column depicting the values will be followed by its corresponding POISSON value, We will arbitrarily set the POISSON random variable as 1 and calculate the Poisson probability: P(X = x) in all cases, to compare values. Thus, the product we will select to sell from now on will be the one with the highest Poisson value. This highest value will appear under the SORT column.
Each statistical tool will have the corresponding POISSON value and in the last column we will then choose the product with the highest value.
AI-MACHINE LEARNING
I need to build workflows which will calculate:
- Lambda
- Exponential Smoothing
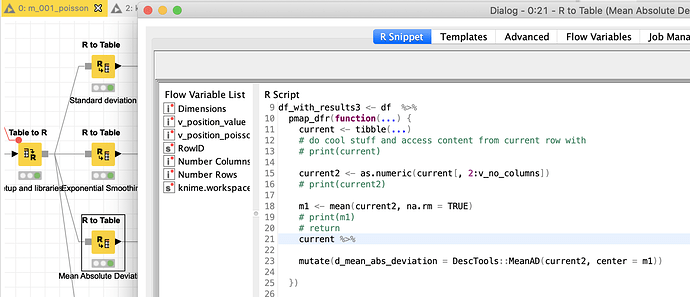
- MAD-Mean Absolute Deviation
- Standard Deviation
- The Poisson Value of each of the mentioned tools above
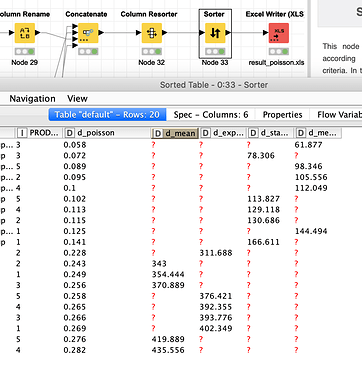
- SORT. The model will sort the Poisson values, from A to Z and the highest will correspond to the product selected to be sold from now on.
End of the procedure.
 )
)


 :
:
