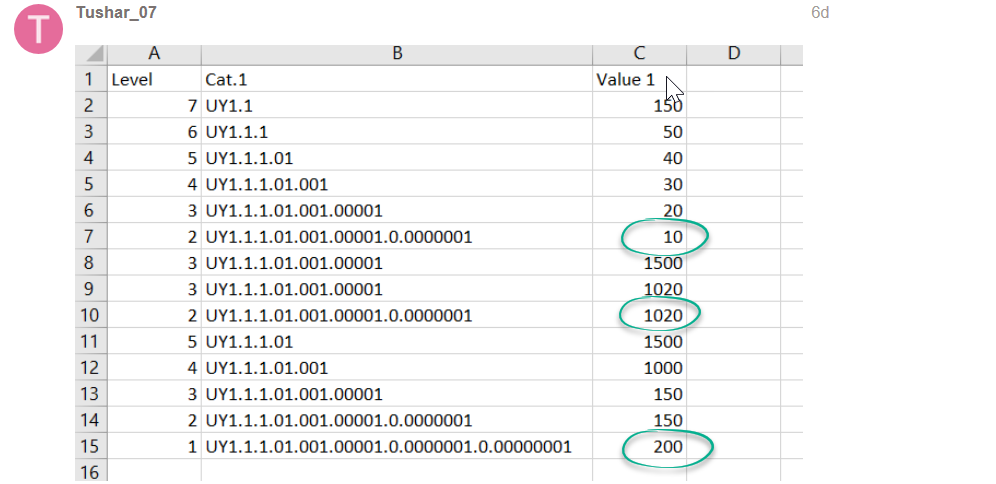
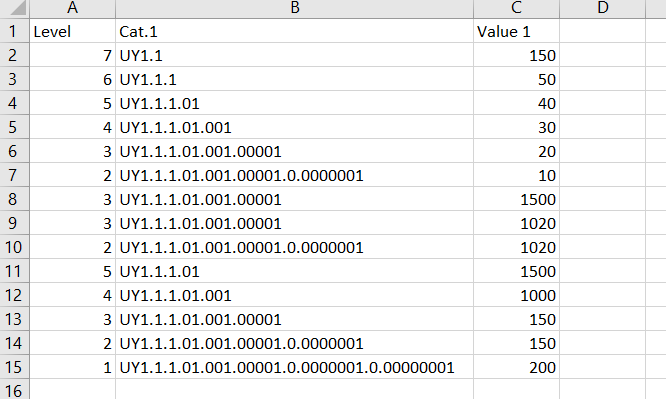
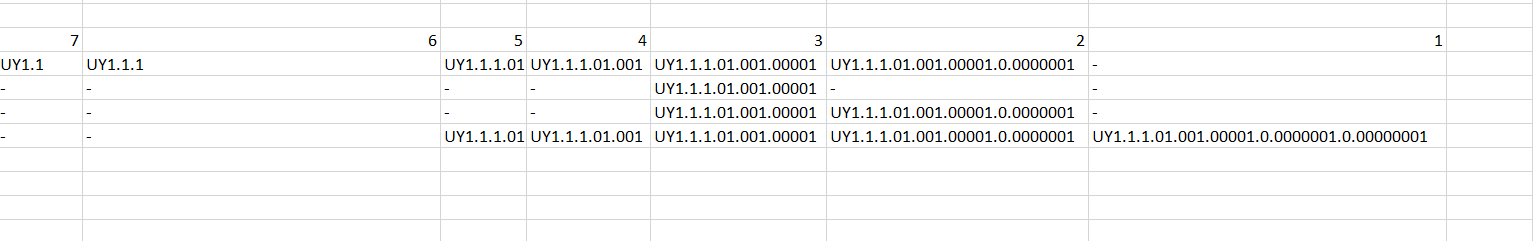
I have table like this. I have level in column 1. I want to make columns for the different levels. Also I want to format rest of the data accordingly like the following image.
I used pivot node but because of the levels are not consistent Itdidn’t work properly. May be I need to use lagging function (Which I don’t know how to use) to identify different parent and sub section every time I pivot the level column. Can somebody please help me with this?
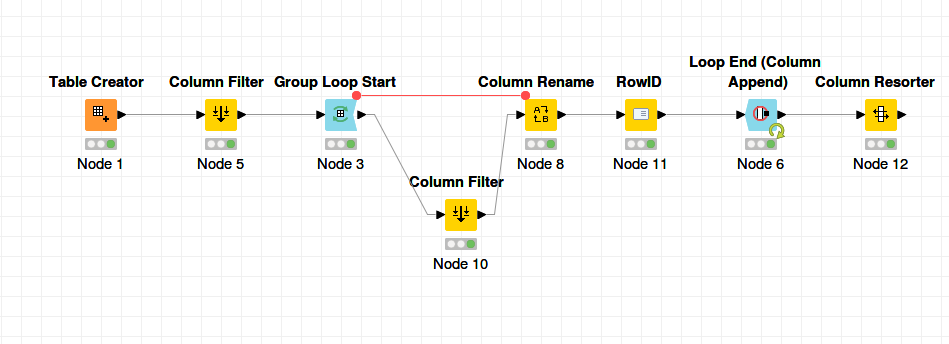
You can solve your problem by using a group loop node , as shown. The only thing this wf does not fix is the empty rows in your result. I don’t where they come from…format.knwf (29.3 KB)
The output data is actually in 4 groups. Each group is 1 iteration of the numbers (levels) from the highest to the lowest.
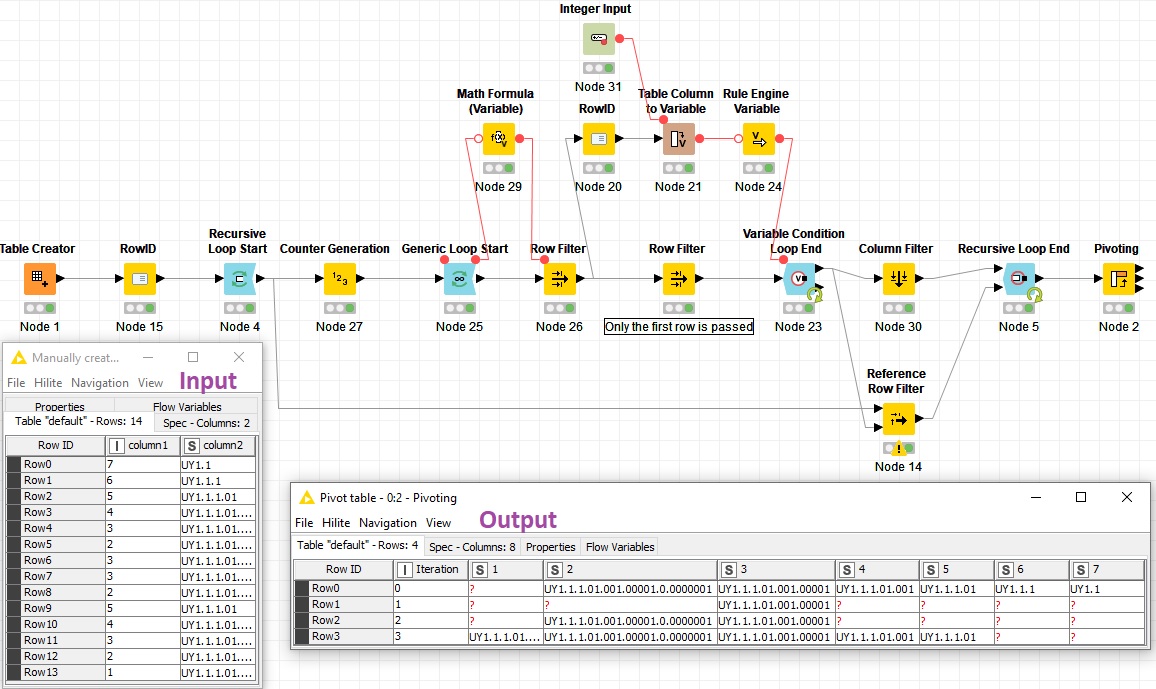
To complete this task, you have to loop over the rows and check whether the level value is decreasing or not. If decreasing add the rows to the loop end for the current iteration of the loop and as soon as you reach the equal or greater level, reset the loop and filter the passed rows (this needs a recursive loop). You do this for all the rows and then after the loop use pivoting node to group based on the iteration number column, pivot on levels and aggregate the Cat.1 column (the “First” value works then).
I have done something similar to this in one of the previous topics.
Also in the final result table, If I only care about the last value for each group from the column “Value1”. How can I define that logic during pivoting?

 nice
nice