PatrikS
February 23, 2023, 12:22pm
1
Hello,
Hallo,
Unfortunately I have to use an online translator and hope that it translates usefully, thanks for your understanding.
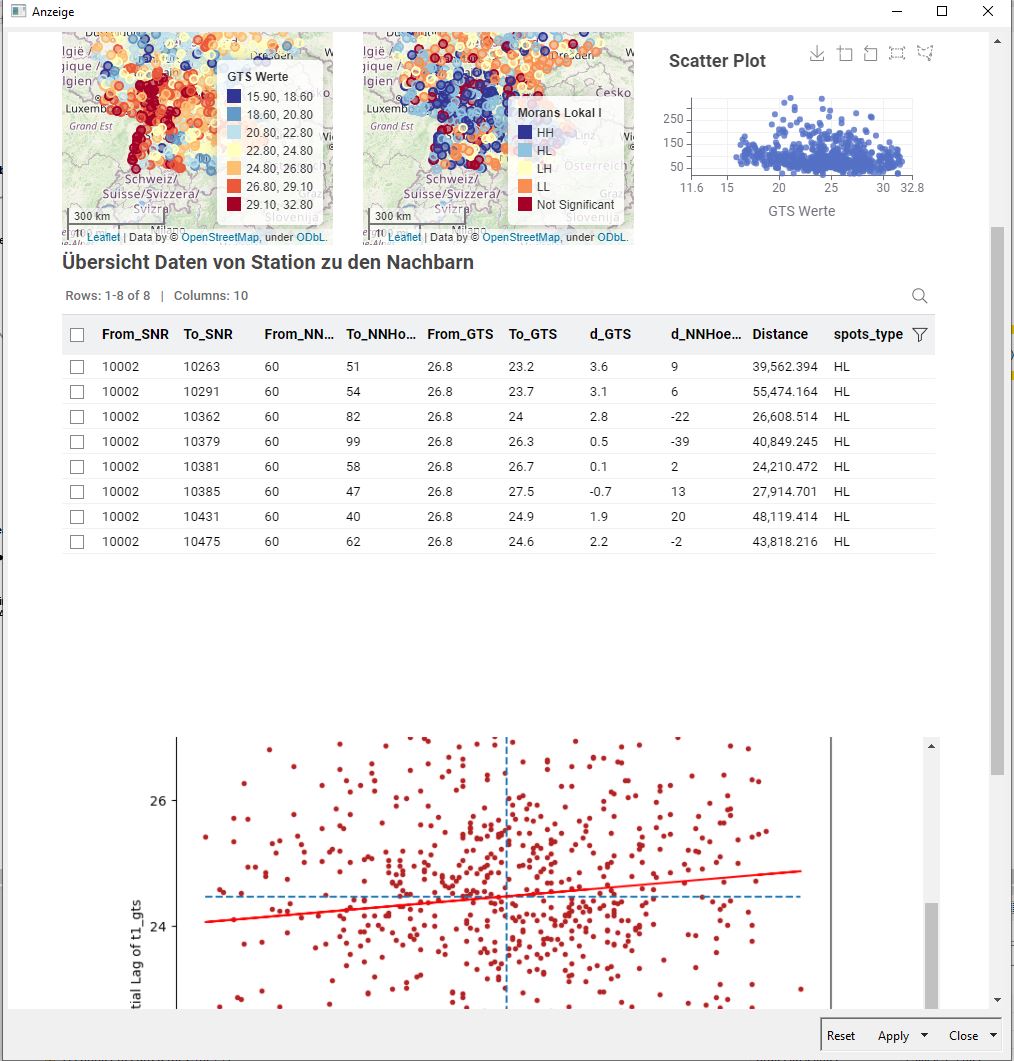
For a long time I have dreamed of developing a dashboard with KIME that I can use to evaluate data with Geotools. The following figure shows how I imagine the dashboard.
[Geo Analytics 26]
Left map the daily values for a PW_IDX and AR_IDX combination
Right map Moran’s local I calculation showing the assignment (line) of focal neighbors from the Spatail Weight Matrix.
…
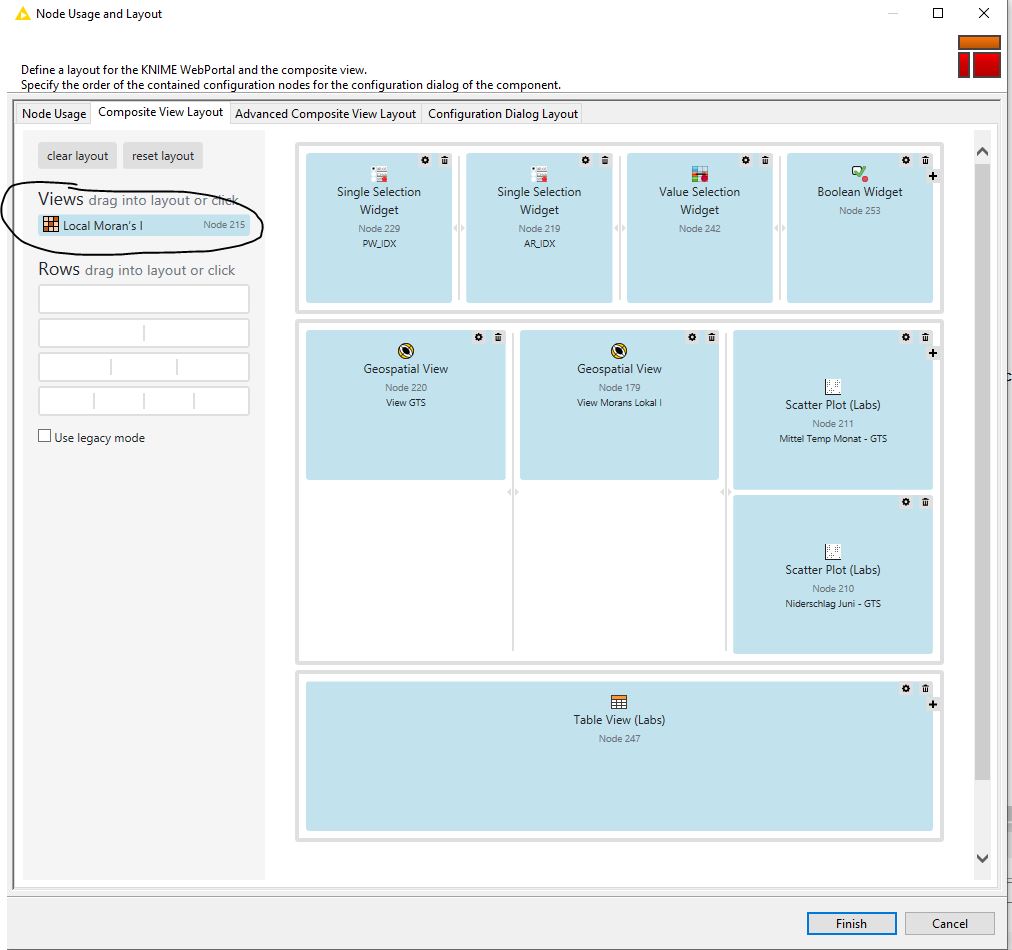
The component view is structured as follows.
However, the display always shows the Local Moran I scatterplot. Although it is not included in the layout. I’ve recreated the layout several times. Always the same.
Best Regards
Hello PatrikS ,
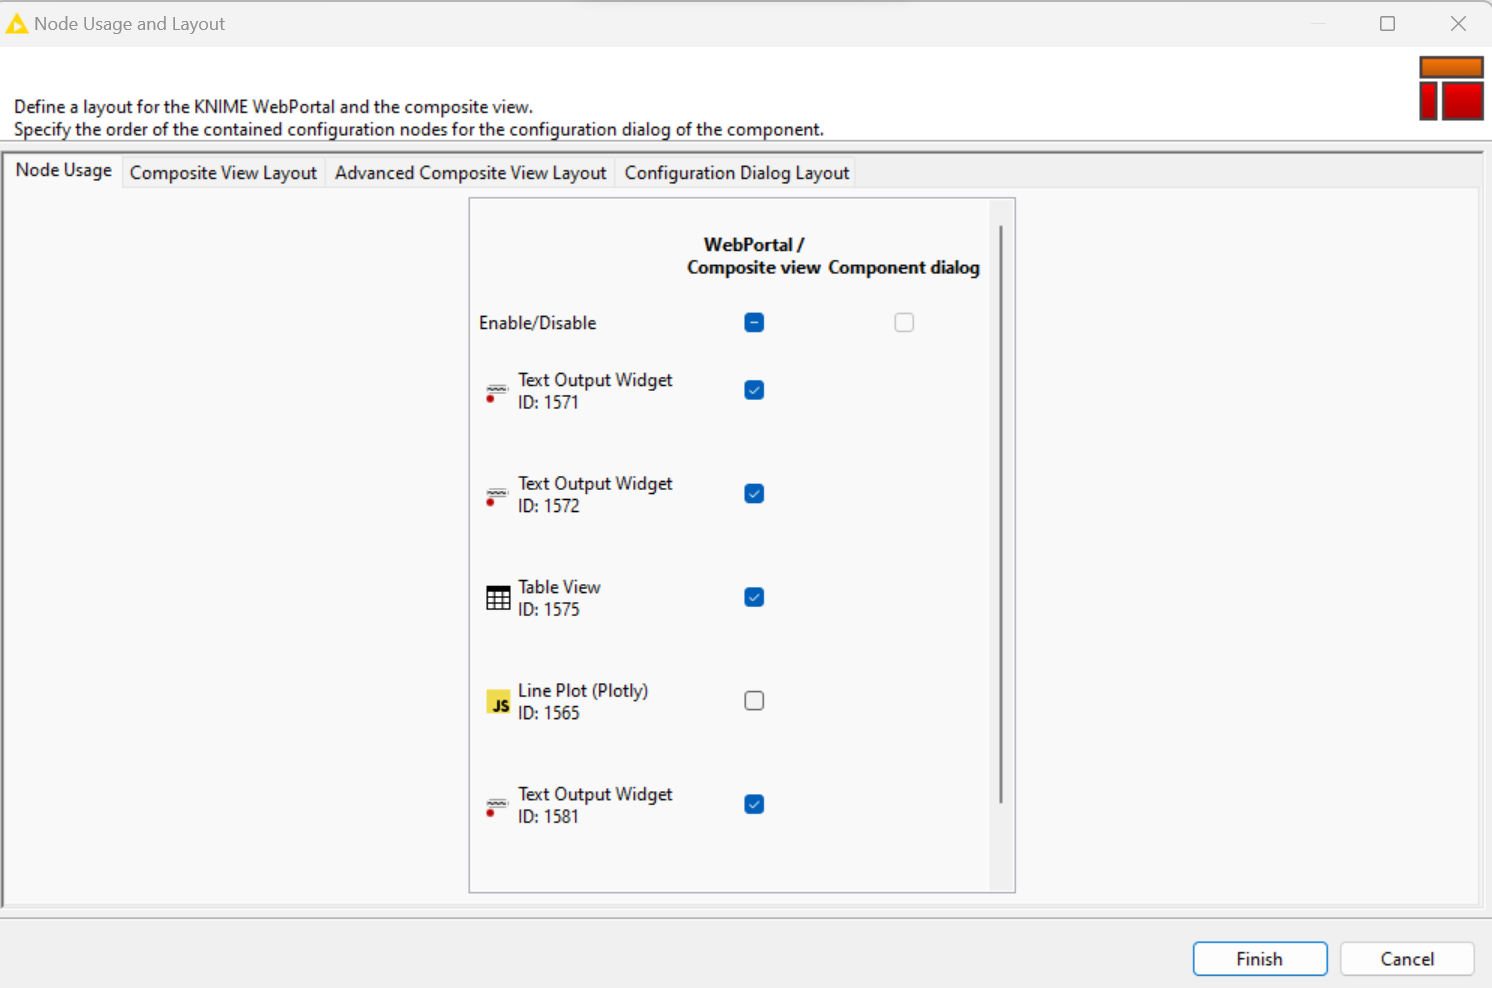
Can you try unchecking the plot?
Something similar to below :
1 Like
Hello k10shetty1,
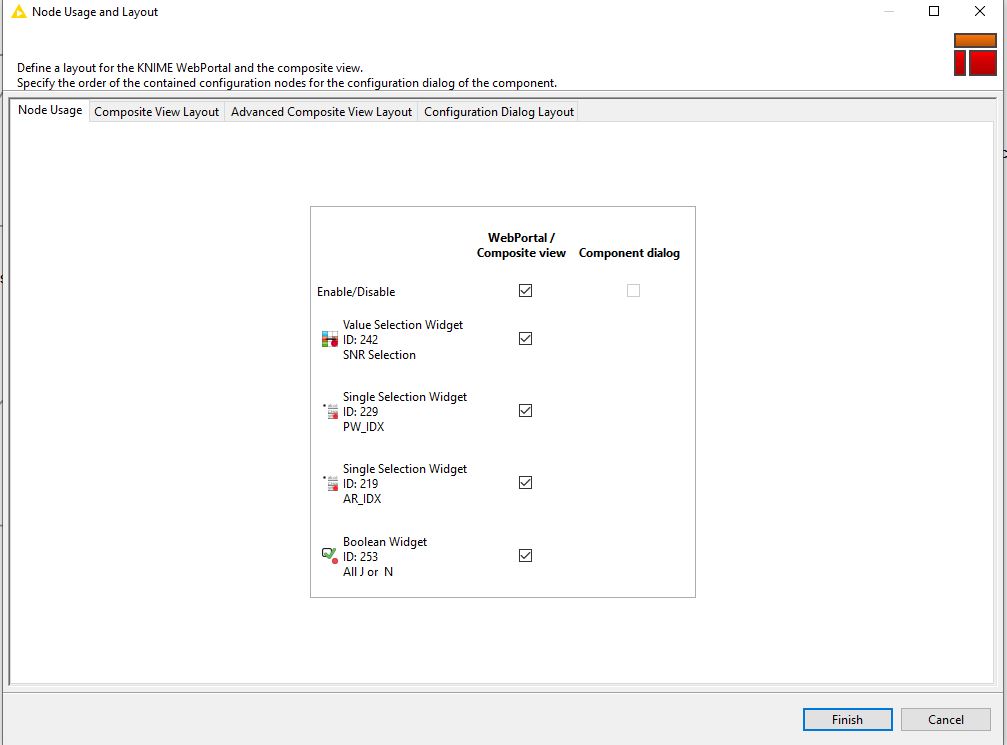
I’ve looked at it, but nothing is displayed for the node that generates the scatterplot.
Hello PatrikS ,
I am sorry for the late reply. The new views (including the matplotlib created view in the Local Moran’s I node) do not appear in the node usage tab yet. So there is currently no option to hide them.
Best,
ScottF
March 31, 2023, 9:59pm
5
Hi @PatrikS -
We’ve created a new ticket to log this issue (UIEXT-863). Thanks for your reporting the issue!
system
June 29, 2023, 9:59pm
6
This topic was automatically closed 90 days after the last reply. New replies are no longer allowed.