Hallo,
Unfortunately I have to use an online translator and hope that it translates usefully, thanks for your understanding.
For a long time I have dreamed of developing a dashboard with KIME that I can use to evaluate data with Geotools. The following figure shows how I imagine the dashboard.
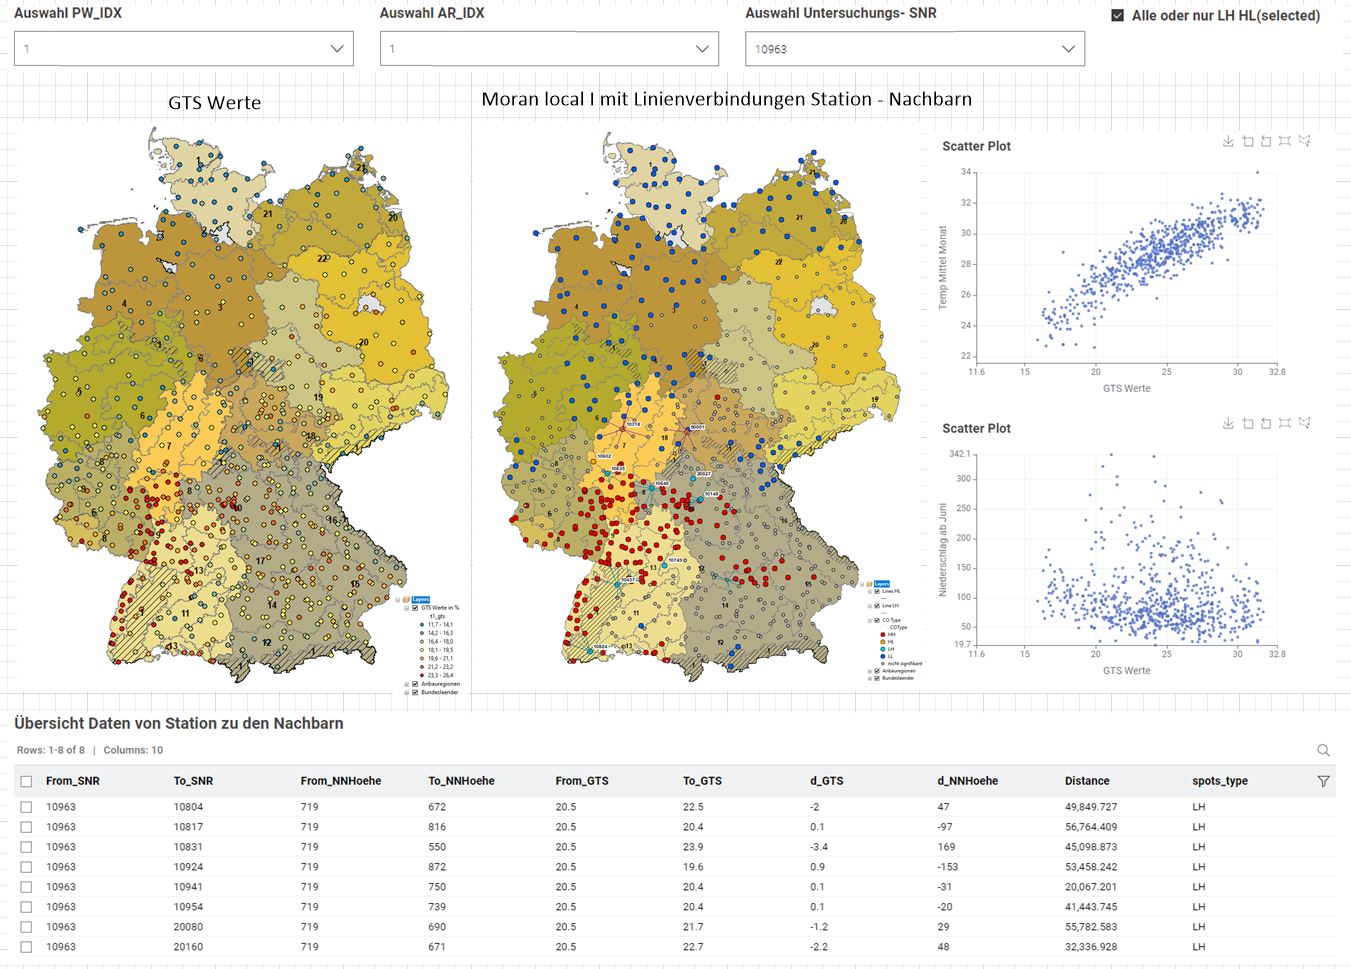
- Left map the daily values for a PW_IDX and AR_IDX combination
- Right map Moran’s local I calculation showing the assignment (line) of focal neighbors from the Spatail Weight Matrix.
- Two scatter plots
- A table with which I can look at the data of the stations. Focal, neighbor from the Spatial Weight Matrix assignment.
The aim here is to identify outliers in the data in order to analyze them.
First of all, I managed to do it, even if not in the way I imagine it.
The following main points are to be described here:
- Brief description of the dashboard
- I’ll go into the problem with the Spatial Weight Matrix again here. See post
- Moran’s Local I incorrect result or is it my Spatial Weight Matrix
- Geospatial View visualization node
Dashboard
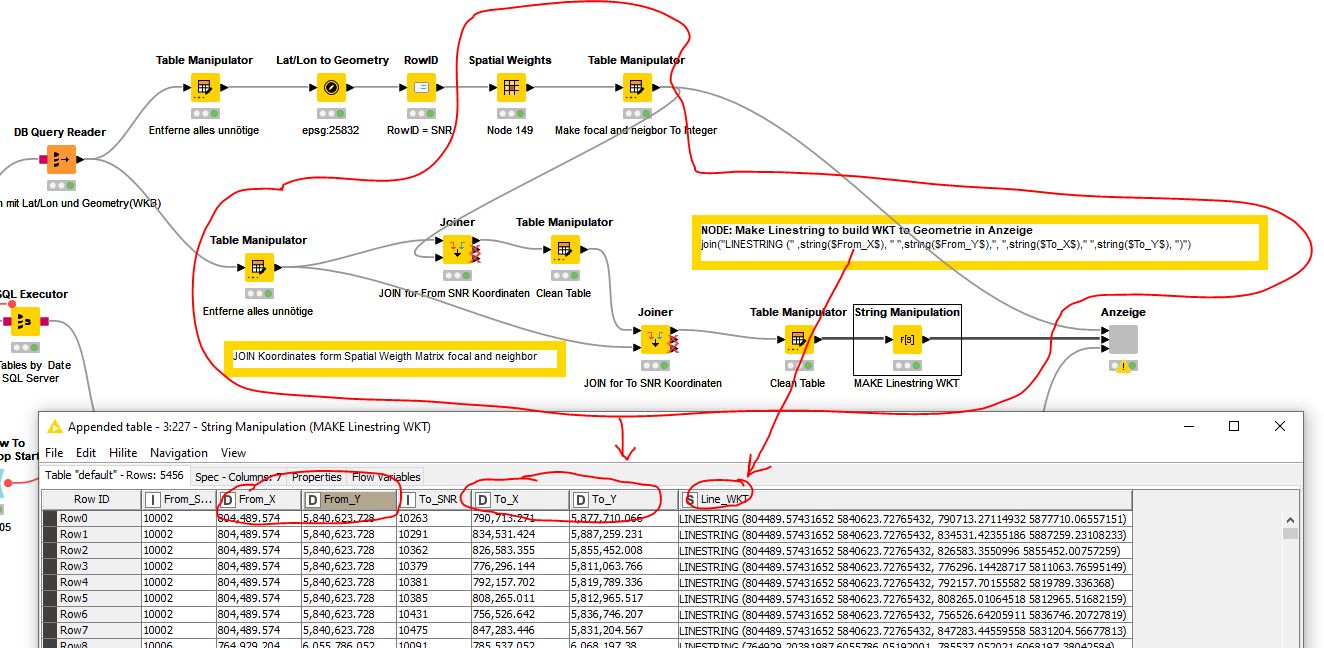
The first part is the data preparation. There were only two problems here:
- How do I create the geometry column from WKB.
- How to create the line geometry from the coordinates from station(Focal) to station(Neighbor) using the spatial weight matrix.

WKB to Geometry.
Is implemented as follows. Thanks to Tobias Koetter for the tips.
Node DB Query Reader
Read all Kombinations PW1-9 und AR1-9
WKB to WKT for WKT to Geometrie:
SELECT “OBJECTID”,“SNR”,“stationsname”,“status”,“nnhoehe”,“datum”,“wd_idx”,“tag_im_jahr”,“sum_N_1woche”,“sum_N_2woche”,“sum_N_abJuli”,“mittel_T_woche”,“mittel_t_monat”,“pw_idx”,“atermin”,“bk_idy”,“bk”,“rs_idx”,“sorte”,“reifegruppe”,“areife”,“Info”,“NR_Kiel”,“t1_gts”,“SHAPE”.STAsText() AS shape_WKT,“SHAPE”.STSrid AS shape_Srid $${SSQL_From}$$
WITH
SHAPE".STAsText() AS shape_WKT for WKB to WKT for WKT to Geometry Node
With a node “WKB to geometry” you could save yourself this step. Should be possible. Please refer:
https://geopandas.org/en/stable/docs/reference/api/geopandas.GeoSeries.from_wkb.html
Create line geometry:
I couldn’t do anything with the “Points to Line” node, since there is no possibility to create the line from point to point.
I couldn’t find out how this should work with the node.
Solved as follows
Creation of a column with WKT LINESTRING
join(“LINESTRING (” ,string($From_X$), " “,string($From_Y$),”, “,string($To_X$),” ",string($To_Y$), “)”)
It would be nice to have a separate node for such a line structure. Not everyone knows the Simple Feature specifications.
Here it also becomes clear, why the Spatial Weight Matrix must be created using an ID column.
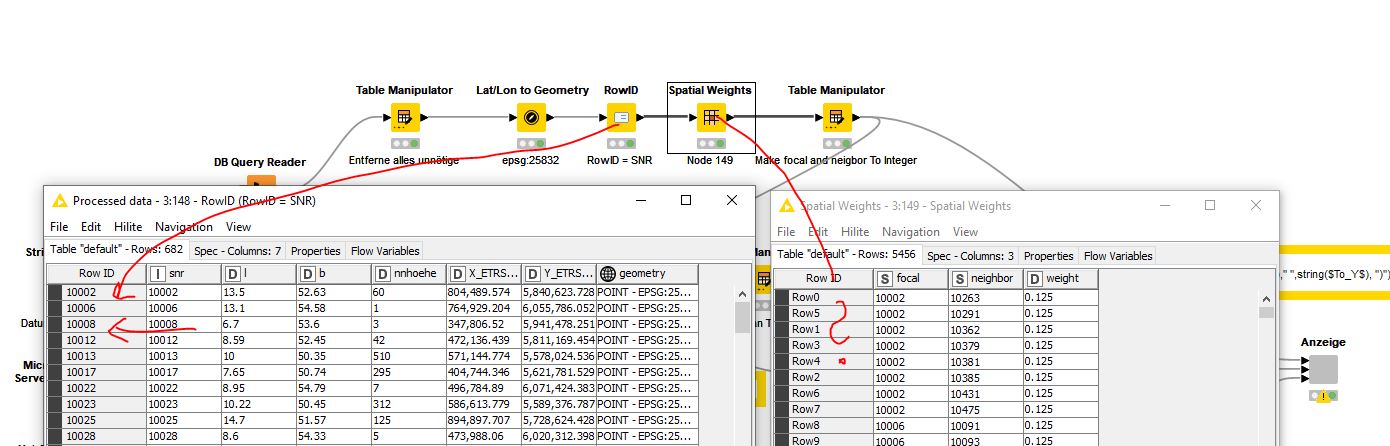
Spatial Weight Matrix
I have already posted the problems I have with this, see:
https://forum.knime.com/t/geospatial-extension-test-problems-and-bugs/59240/4?u=patriks
Focal and neigbor must be INTEGER, otherwise Moran’s Local I and other nodes that require the Spatial Weight Matrix will not work.
Creation via an ID column is necessary, as do other programs like GeoDa and ArcGIS.
Morans Local I incorrect result or is it due to my Spatial Weight Matrix
The figure shows how I structured the data for creating the Spatial Weight Matrix. (RowID = SNR).
However, the Spatial Weight Matrix is created as in the table on the right.
Is it because Moran’s Local I gives erroneous results.
Because if the assignment is made via the RowID, how should the focal neighbor relationship be determined?
That should be discussed with the developers. See the post below:
https://forum.knime.com/t/geospatial-extension-test-problems-and-bugs/59240/4?u=patriks
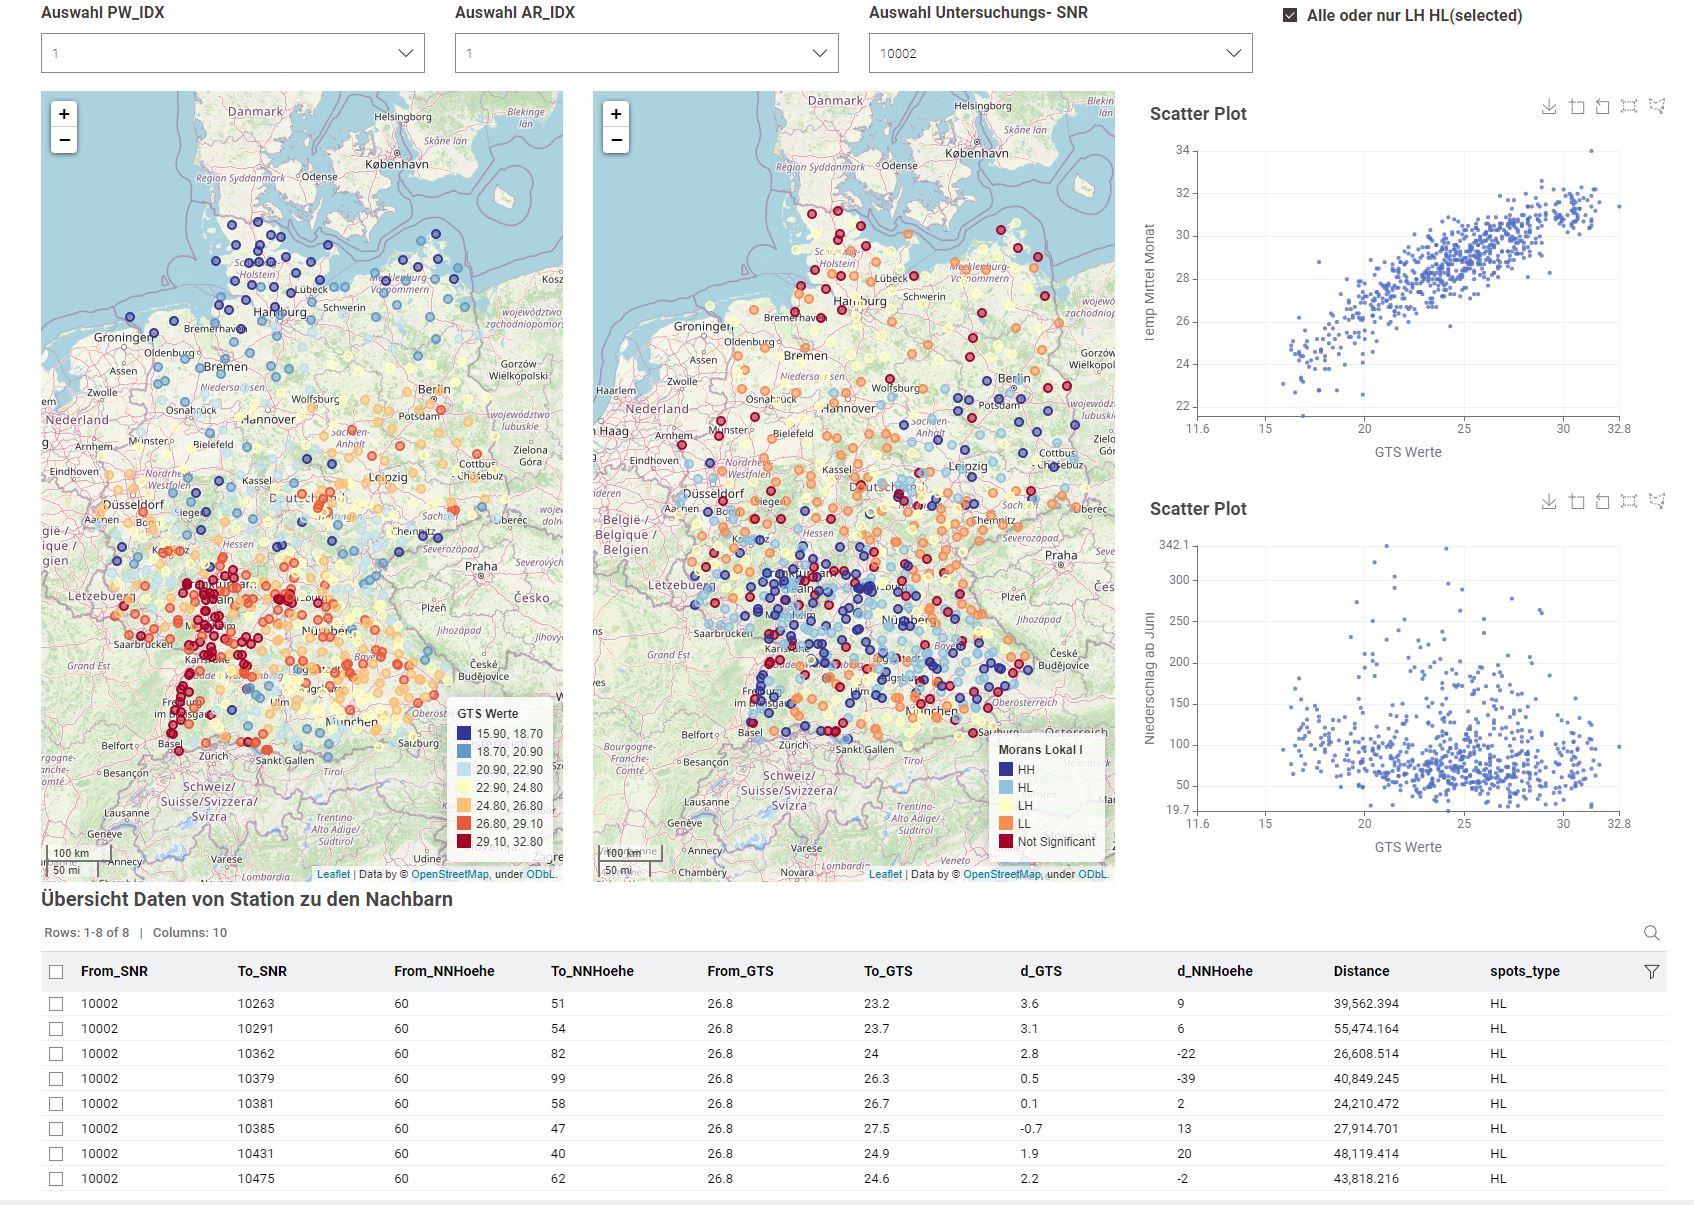
Geospatial View and Component View
The Component View looks like this. It contains some widgets, a case and some calculations like delta NN height, delta GTS, and distance, always related from station(focal) to station(neighbor).

And this is what the view looks like. Succeded.
Here are a few ideas
Color palettes are listed by name. In the help is a link where you can see the color scheme. So far OK. But the names should be sorted in the list, then it’s easier to find your way around.
Visualization
Classifications are offered many options, many I do not know.
Are there or is any of these Geometric Intervals?
What is missing:
But what we need is a representation according to categories. You choose the appropriate column. The values are clearly displayed with a suggestion for symbol and color. You can then edit it:
icon, size, color
As at the beginning, in the right map.
Geospatial View
As you can see in my design at the beginning, I used my own layers as a background to better visualize the representation of the points and colors. There is also a technical background for the background map here.
Background map idea:
A node for creating a background map. Input 1-n layers from the database. Show nodes. Carry out order and color representation.
Then pass the result to a two-input geospatial view.
Data table above, background map below.
Geospatial Combined View
Merge 1-n layers. layer settings. (In the example here point and line layer)
Entrance for background card.
Interaction Scatter Plots – Map
If you select a point in the plot, it is also displayed in the other one, great. It would be nice if this also went to the cards.
Labeling
An attribute should be possible for the label in the map. Font alignment (bold, italic…) and size. Here in the example for the points the station number (SNR)
Conclusion
As already mentioned, a successful start for KNIME and Geotools. I’m enthusiastic and if one or the other idea goes into the ToDos, I’m happy. There are enough ideas and there will certainly be many more, not just from me. Also because the technical disciplines are so endless.
Thanks to the team and keep it up.
Best Regards
Patrik