I have a stacks of 5 images, of which 4 contain the signal for a fluorophore( CFP, GFP, YFP, Cherry) and an additional image with the nucleus dye SiR- Hoechst( similar to DAPI). I have already been able to detect the postive cells for each fluorophore and in the end get a table of :
Nuclei:ID Signal_CFP ; GFP ; YFP ; Cherry ; SiR-Hoechst
Text_ID value in Numbers
The Nuclei IDs are created through the combination of the nodes "connect component analysis and “Image segment features” and i then look if there is signal in the other channels and save the “overlap” as the signal value
I now want to colour the nuclei depending on which fluorophores are positive for them in specific colours, but have no idea how to do this…
Hey @Landerhe, this sounds like an interesting application, which should not be too hard.
You could create a labeling image where the labels represent the active fluorophores and then use the Labeling to Image node to turn that into an image.
I would need an example dataset + workflow though to give you more specific advice, so if you could upload it I can help you out further.
Hi @Landerhe,
thank you for uploading the workflow, but it seems something went wrong during the export, I can not successfully import the workflow into my KNIME Analytics Platform (I get a lot of errors on opening the workflow and it looks all messed up). I inspected the archive and it seems that it contains the default example workflows from your KNIME-AP installation as well as other workspace metadata.
Can you try re-exporting the workflow, or maybe create a new workflow and copy all the nodes into it and export that one?
Also the workflow did not include any images, it would be best if you upload an example picture separately.
Hi @Landerhe,
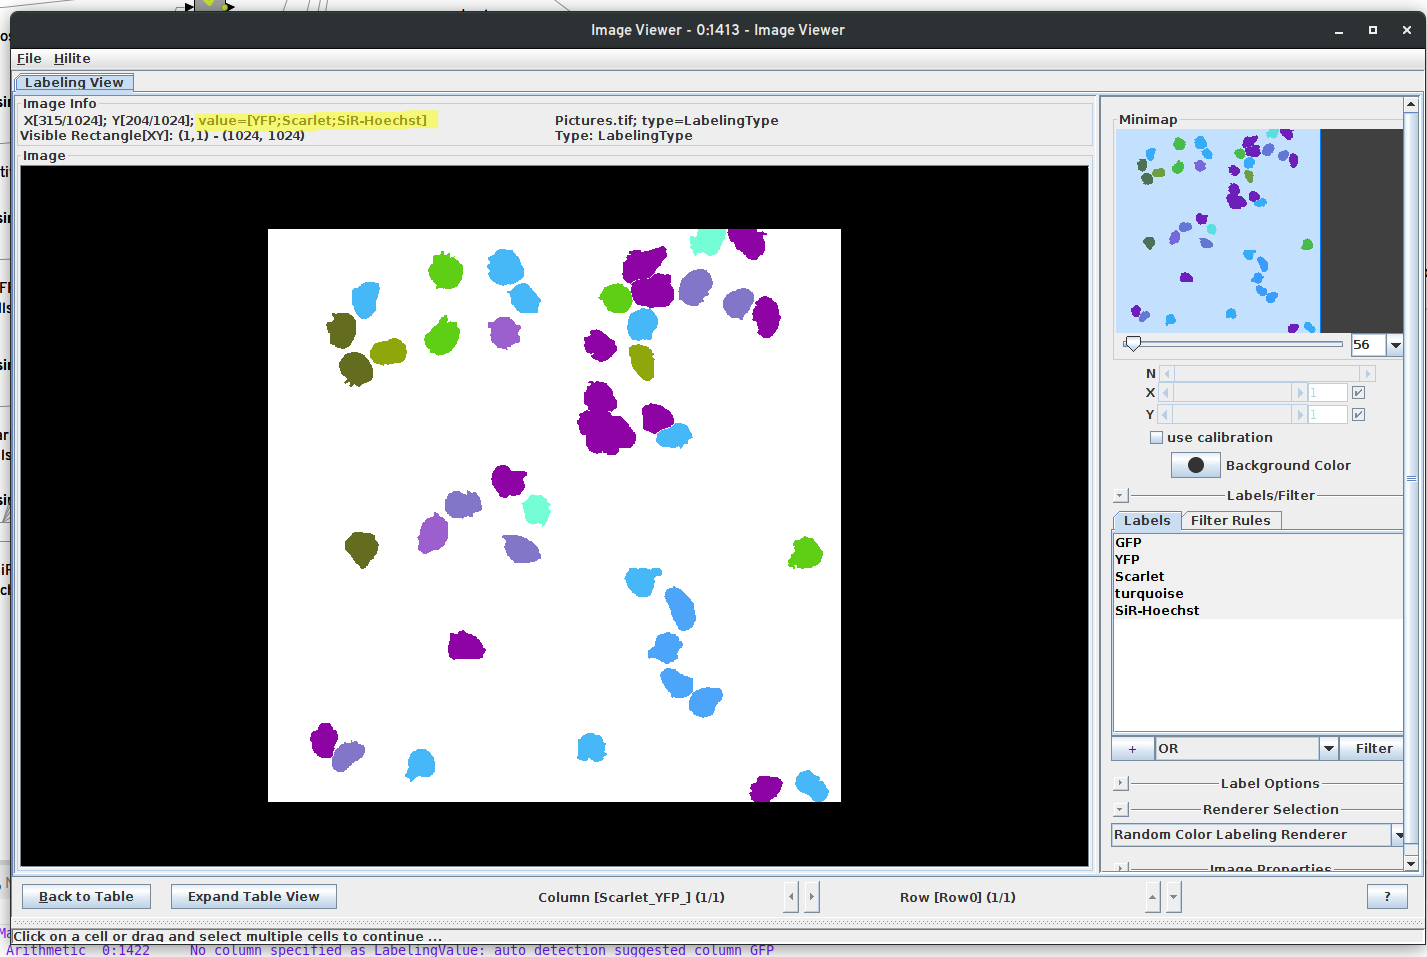
I was able to create the following quite easily using the Compose Labeling option in the GroupBy node, I hope it helps you in the right direction: