This example is showing a quite complex report with different objects. Most of the voodoo is done in the component CO2 statistics by country. This component creates as output just a few views, plots and charts. None of them has an output.
But the used loop end with node Model Loop End requires an input. How can I connect a simple Table View Node with the Model Loop End Node?
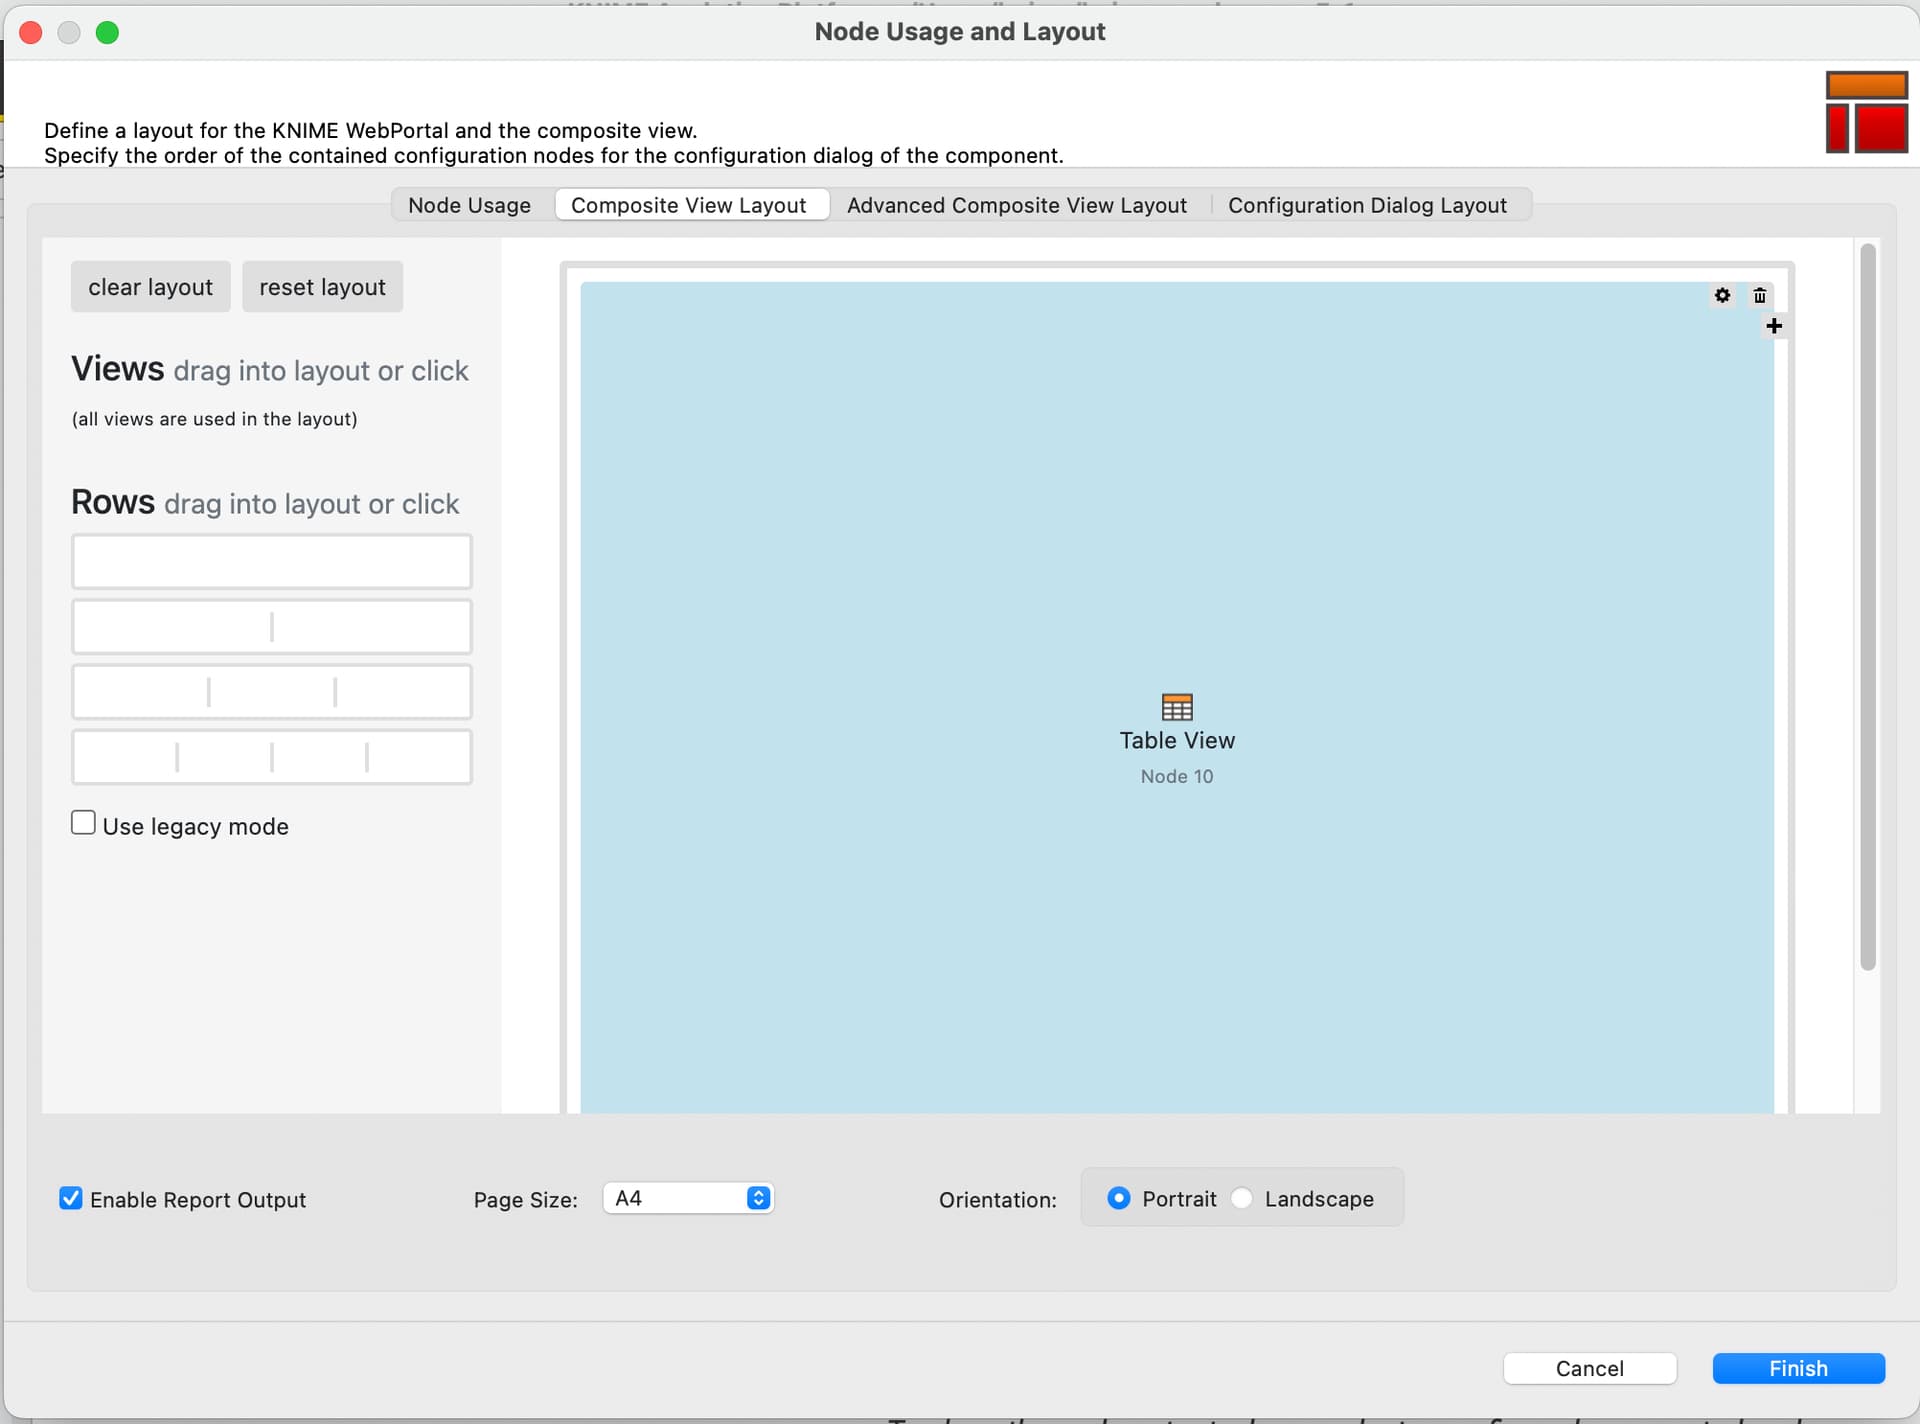
the general idea is that the report is created with the content of a Data App. After creating this Data App you have to go into the layout editor and check the checkbox at the bottom. With this done the component will get an output port which you can then connect to the loop end. The Table View will never get an output port, but the component will collect everything that is visible in the Data App View and convert it into a report.
@DanielBog
Thanks for your support. Please apologise me asking again such stupid questions.
I assume that I’m missing one small, but very important part of this puzzle to create a report in this way.
Using BIRT took me also some time to understand it. But at least the examples have been that clear to me that I was able to crunch most of the challenges.
Where / what is this “Data App” located?
I tried to find it in the above mentioned sample workflow. But I was not able to locate it. There’s also no node with such a name.
Could you please point me to this Data App in the workflow example Multipage PDF Report from Single Source – KNIME Community Hub ?
there is nothing to apologise for. We call these interactive components Data Apps. In this case the Data App/Component I was talking about is the “CO2 Statistics by Country” component. There will also be a blog posts about this topic explaining this in more detail. But for now let me try to explain it.
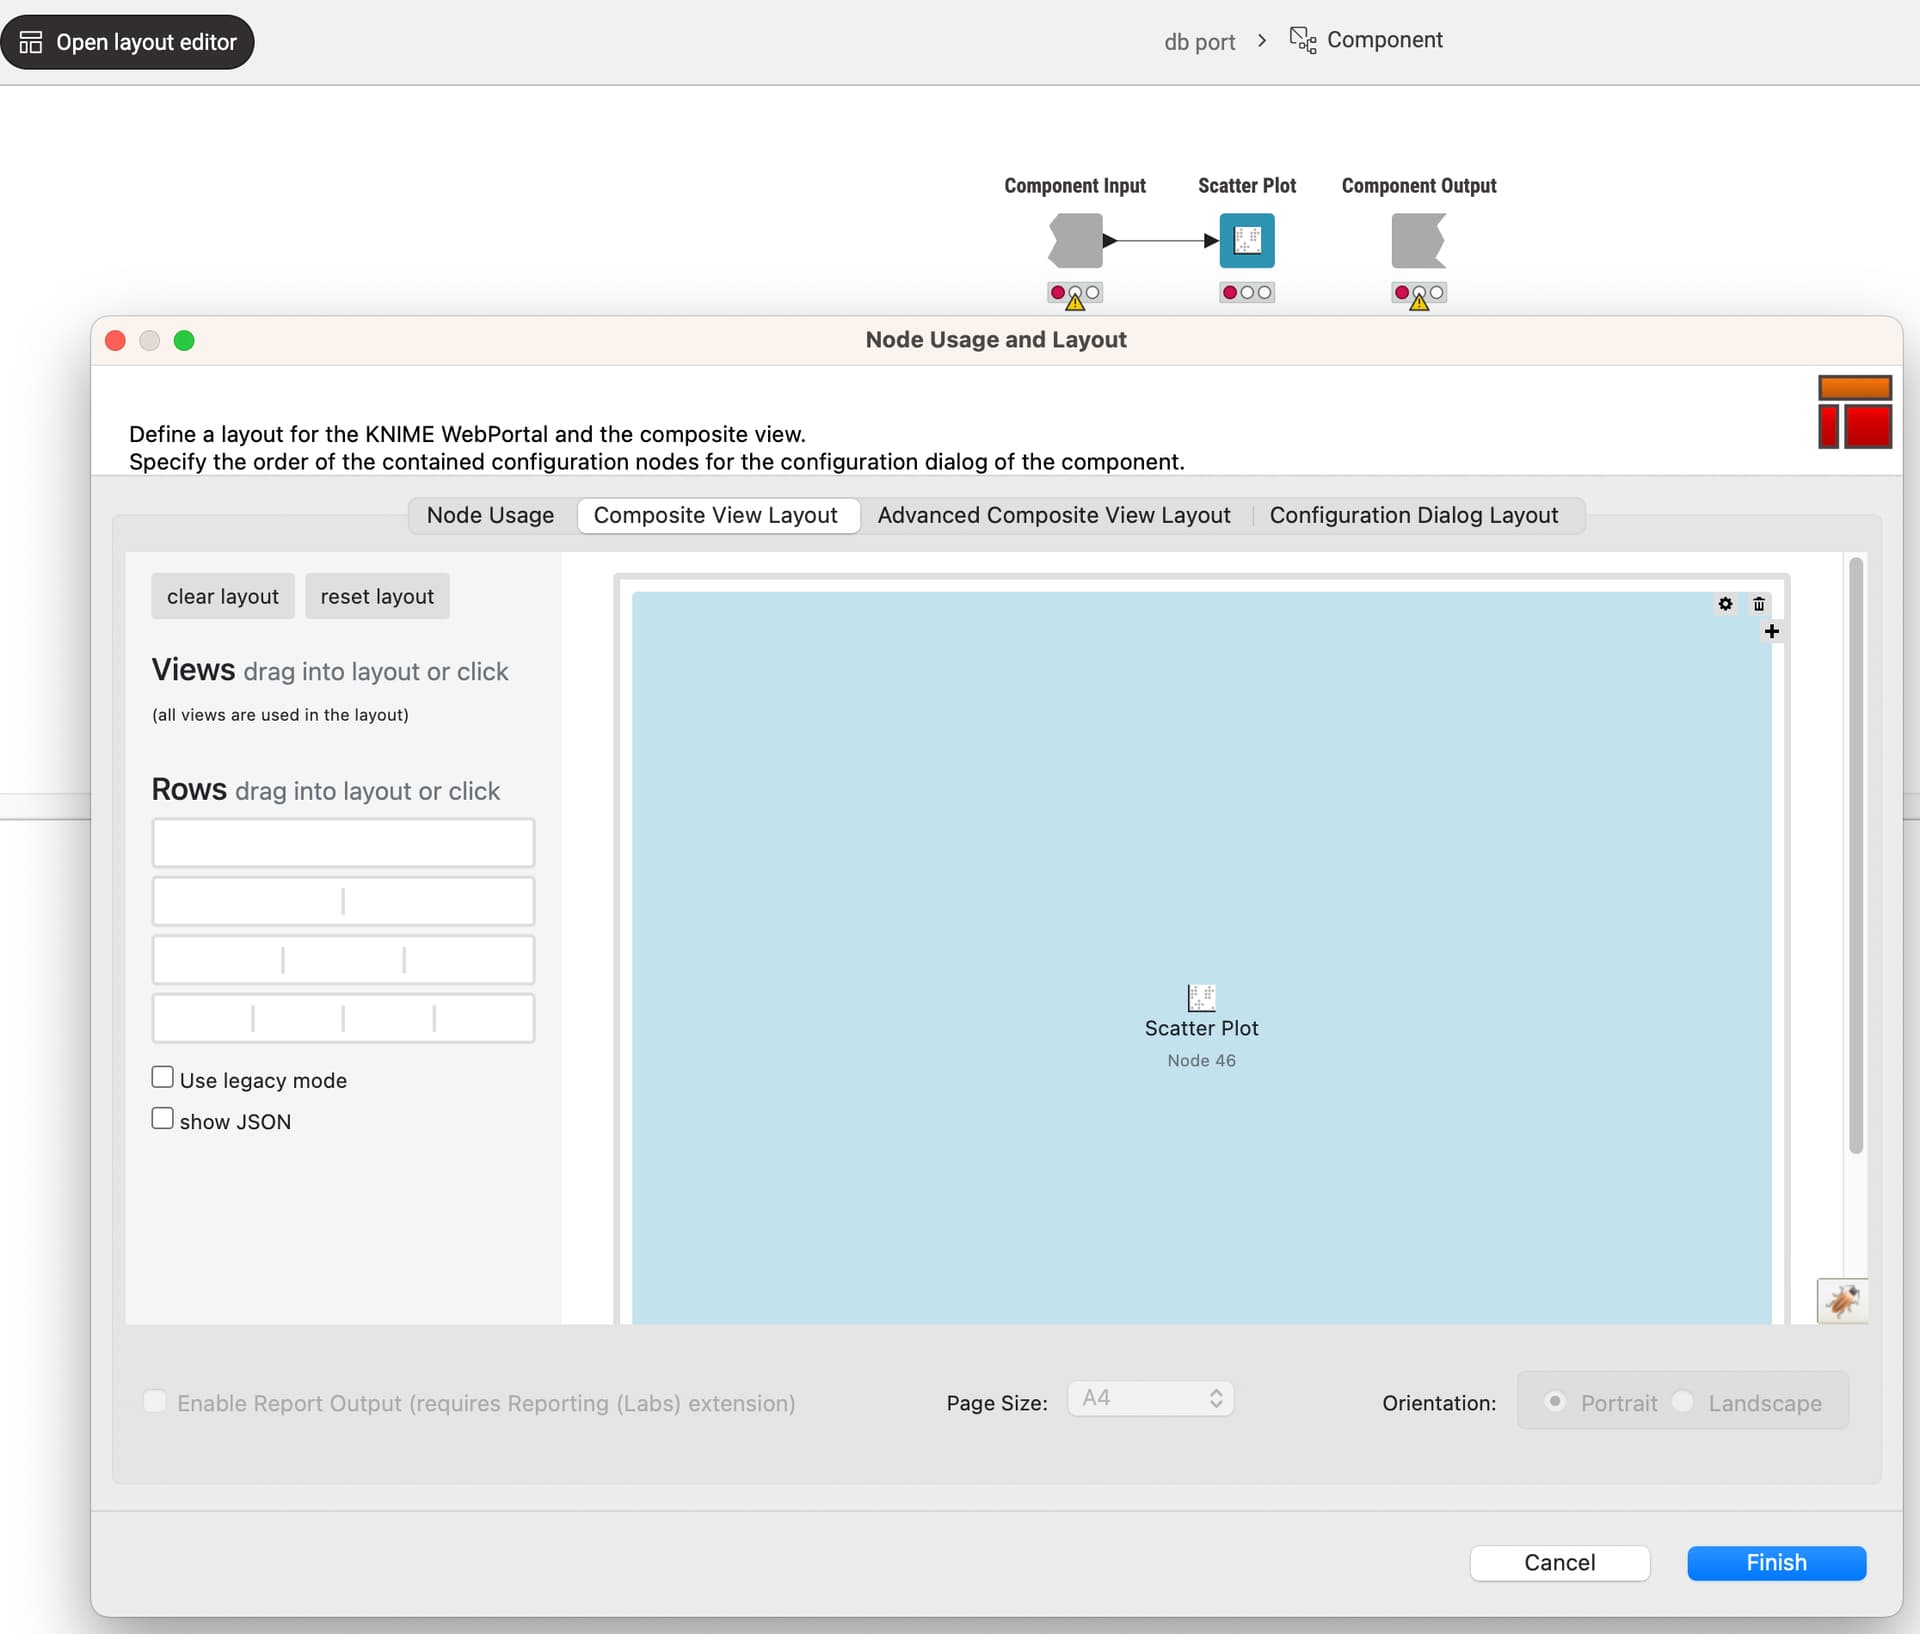
In KNIME you can put visualisations into components, which enables you to group them into a logical component we call Data App. As soon as you are inside this component you can open the layout editor of this component and layout your views in the way you want them to appear once you open the view or later the report of this component. The idea of the new reporting framework was to make use of this already existing functionality and take these already layouted Data Apps and put them into a report. To enable this there is this checkbox at the bottom of the component. (You need to have the reporting (labs) extension installed in order to make use of this checkbox)
As soon as you have enabled this checkbox the component will get an additional output port representing a report fragment (internal representation of a report). You can then use these fragments to either concatenate them with other fragments or just write them to a PDF with the “Report to PDF” node.
I hope this helps to clear things up, but don’t hesitate to ask additional questions.