how would you approach data(base) normalization in KNIME?
The reason I am asking is that I am diving head first into PowerBI and that one is really (as in ‘really really’) slow when it comes to ETL tasks. Nice that MS has given us PowerQuery, but it is a snail compared to KNIME (I guess, I should learn DAX but I just don’t want to )
So I have learned that normalized tables work very well in PowerBI especially if you want to have overview and drill through pages from your data.
The thing is, I have no clue, how I could normalize the data in KNIME?
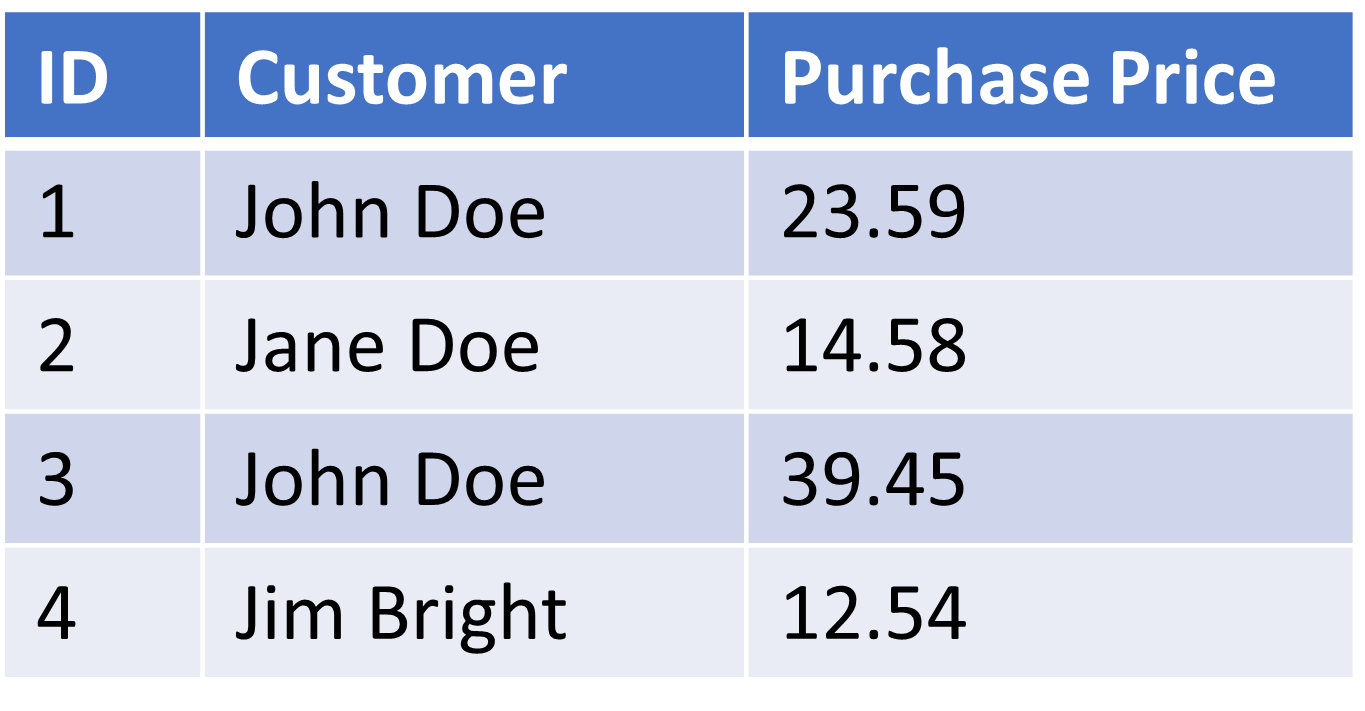
So what I basically want to achieve is to go from something like this:
I don’t know any way to do this but basic ETL. First I make sure the full table is complete with appropriate key IDs to tie things back together. Then I split the streams and start filtering out columns. Once you have split things up, you can start to remove duplicates on the support tables to clean things up. It would be amazing to have some kind of de-joiner that effectively turned datasets into optimized database tables, but that seems like quite an ask.
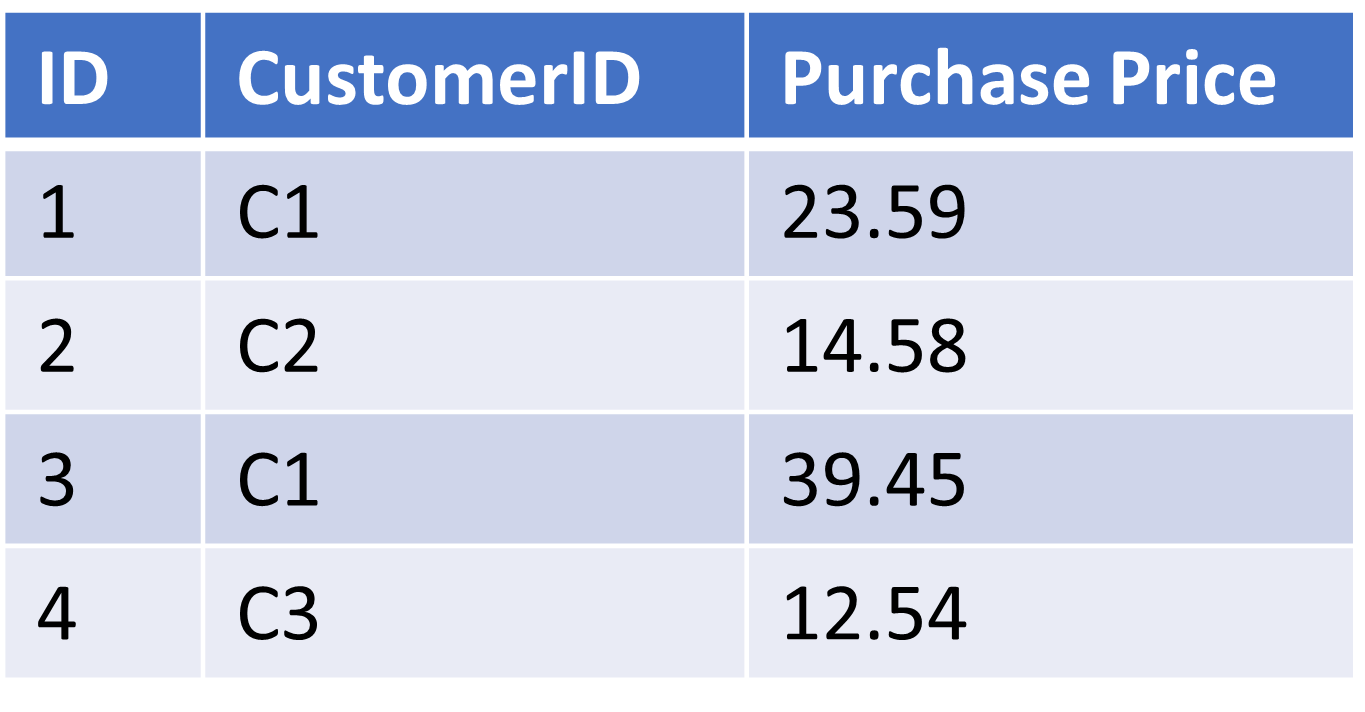
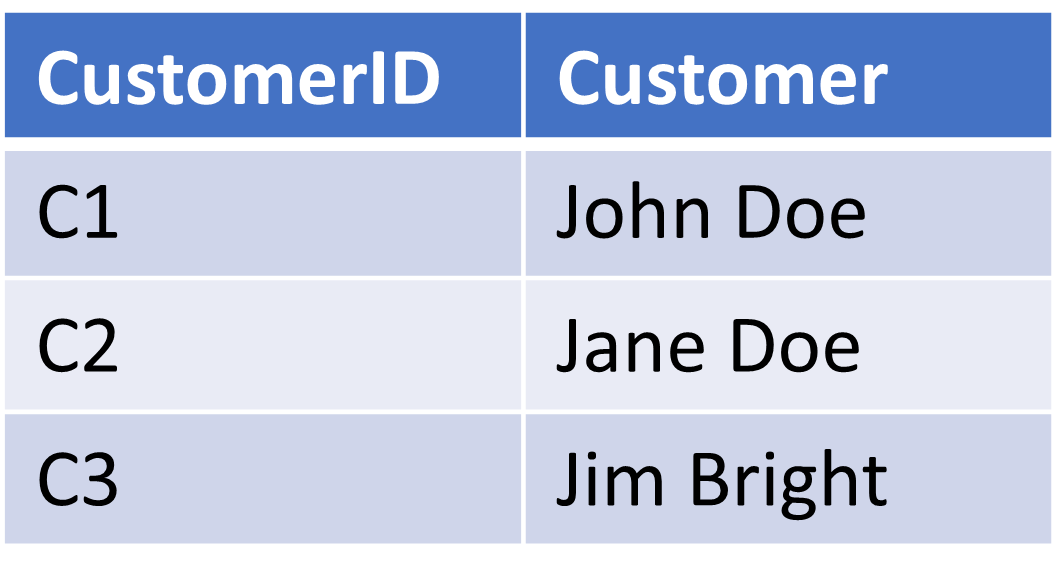
You create the dimension tables by copying the fact table (filter the relevant columns), remove the duplicates, add an identifier e.g. counter node, join it back to the original table to map the id (counter node created) to the column (e.g. name in your screen. You do this for all your dimensions. Finally you remove the text in the fact table (original table) as you have now each column as an id.
br
Thank you @Daniel_Weikert - ok, so it would be a series of nodes. Understood. I just thought eventually I am overseeing something obvious.
Strangely enough, PowerBI (I know it’s not a topic for this forum), creates some additional relationships which I manually need to delete. I have measures this (time wise) and even with that manual step, doing it in KNIME is way faster than in PowerQuery (assuming one at least goes 3x into PowerQuery). The Load Process over there is really a pain.
The auto relationship can be turned of in the Power BI Settings (if desired). Are you referring to the load process in Power BI when refreshing the dataset? Being able to do it in KNIME instead of PQ probably also depends on your data source I guess?
br
thanks for the tips regarding PowerBI (didn’t know that).
In the meantime I found out that I could basically turn off “loading” for refreshs in PBI e. g. for lookup tables. But this is a KNIME forum, so I don’t want to take this discussion too far.
I also must say - totally biased here of course - that I like the visual way of KNIME more than the “M” formulas I see in PBI but that’s just a personal liking. In the end there are always multiple ways to do things and that is just my preferred way
Regarding normalization, this is what I did (for anyone else wanting to do this)
I groupBy the column that I want to “normlaize”
I assign a Rank to get unique IDs (basically an index)
3- I create a specific unique ID using a prefix and the rank number in a String Manipulation Node
I export my dimension table to Excel
I have wrapped this all in a component, so you can see a screenshot of the inner workings of such a component below: