I modified by CSV file using the pivot node but one of the columns from the pivot column has two values which I need separate into two different columns so I can calculate some things. Here is a picture.

2 Likes
Hi there @adepani,
welcome to KNIME Community! NBA data, nice 
So you want to have numbers of shots and misses in separate columns but all misses in one column and all shots in another column? Considering your structure isn’t same (for example always shot number followed by miss number or vice versa) you can use regexReplace function within String Manipulation node. Following syntax will extract number next to miss string:
regexReplace($column1$,".*miss[\\(]([0-9]+)[\\)].*" ,"$1" )
and in another String Manipulation node replace put shot string instead miss to get number of shots.
Feel free to share analysis results with us if possible. You can do this on KNIME Hub. I would be very interested to see them 
Br,
Ivan
4 Likes
Hey thanks for the reply, for the sake for learning, can you explain the function? Because I get the first part, but the rest I don’t get.
And I would be more than happy to share my results. Sorry, I am a undergrad student and this is for my project.
Hi @adepani -
As an aside, can you say which course & university you are doing your project for? We like to keep track of professors who are teaching data science and machine learning with KNIME so we can offer additional help if needed.
If you’d rather not say here (perfectly understandable!) can you drop me a note at scott.fincher@knime.com? Thanks!
Hi @adepani,
it depends on your source data. Is it possible to first run a group by to get counts for shot/miss to get a separate record for each of them? Then it should be possible to define 2 Column headers in the pivot node e.g. distance and “trials” and you should get both in separate columns.
BR
Hi there @adepani,
Not a regex expert but will try ![]()
.* - zero or more characters
miss - obviously word miss
[\\(] - opening parentheses (need two backslashes for escaping)
([0-9]+) - capturing group which allows multiple digits
[\\)] - closing parentheses
.* zero or more characters

$1 - returns first (and only) capturing group in this case
Additionally check regexReplace function description inside String manipulation node and for regex in general see this page for example: https://dl.icewarp.com/online_help/203030104.htm
Have seen also question about doing this for multiple columns. I would suggest to just stack multiple String Manipulation nodes (simply copy paste) and once done create Metanode from it to. Also String Manipulation (Multi Column) node is planned for summer release.
Hope this helps!
Br,
Ivan
2 Likes
Hey, thank you for the explanation. I also have another question/need for help. So I had to pivot my data in another way as well. And this also caused me to have columns with multiple things, and I need to separate them. Any suggestions for this picture? So like the other one, they are separated by the shot zones.
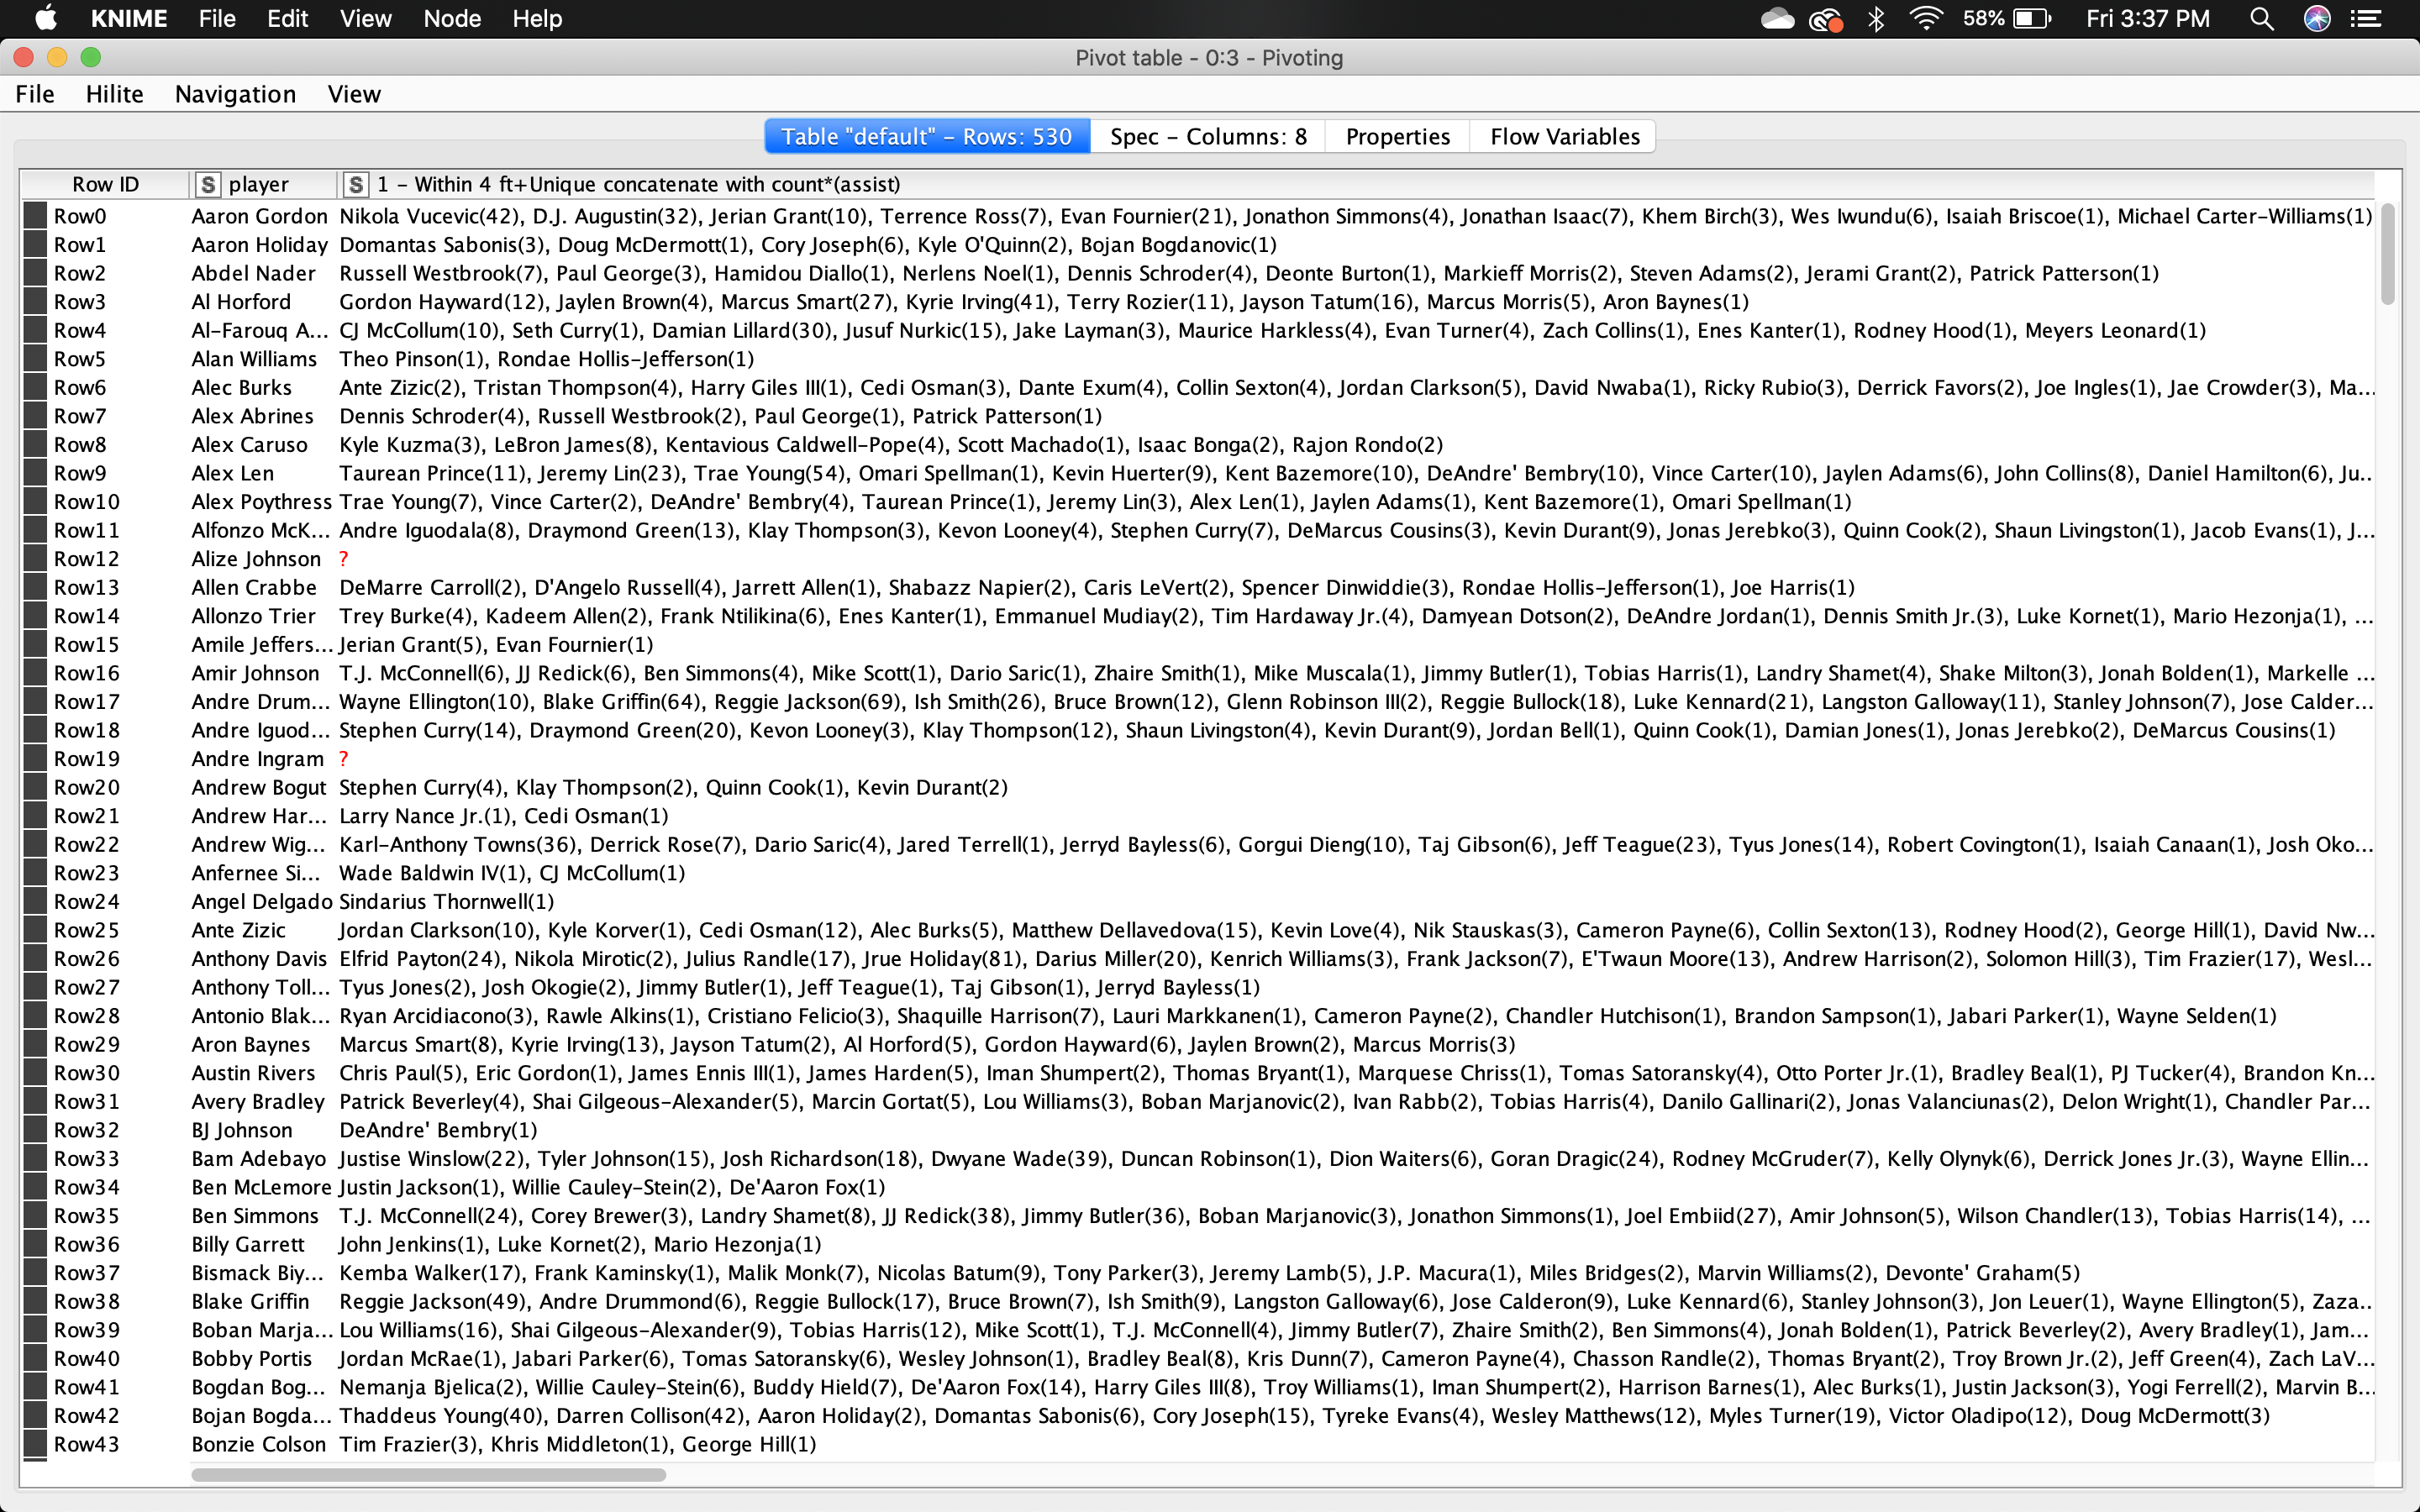
Because what I want to do is create something like this, but now I realize each zone has a different number of inputs, so separating them is not the best option. Is there another way? To do this?

Wait actually I could seperate them because I am selecting all the zones and players at the same time.
Hi there @adepani,
did you find a way to split your data properly? Anyways Cell Splitter with comma as delimiter can help to split each player into separate column if that is what you are looking for.
Regarding your desired visualization. On first I thought Parallel Coordinates Plot node could be used but seems it doesn’t have option to stack lines so they are overlapped. Maybe Sunburst Chart can give you similar insight although in a different way.
Br,
Ivan
1 Like
For some reason I still can’t.
So, basically I am trying to show flow of the basketball to map assists. So basically, every basket is associated with a player who shot the ball, and sometimes, a player who assisted the ball to the shooting player.
The data file, it too big to upload so here is a screenshot.
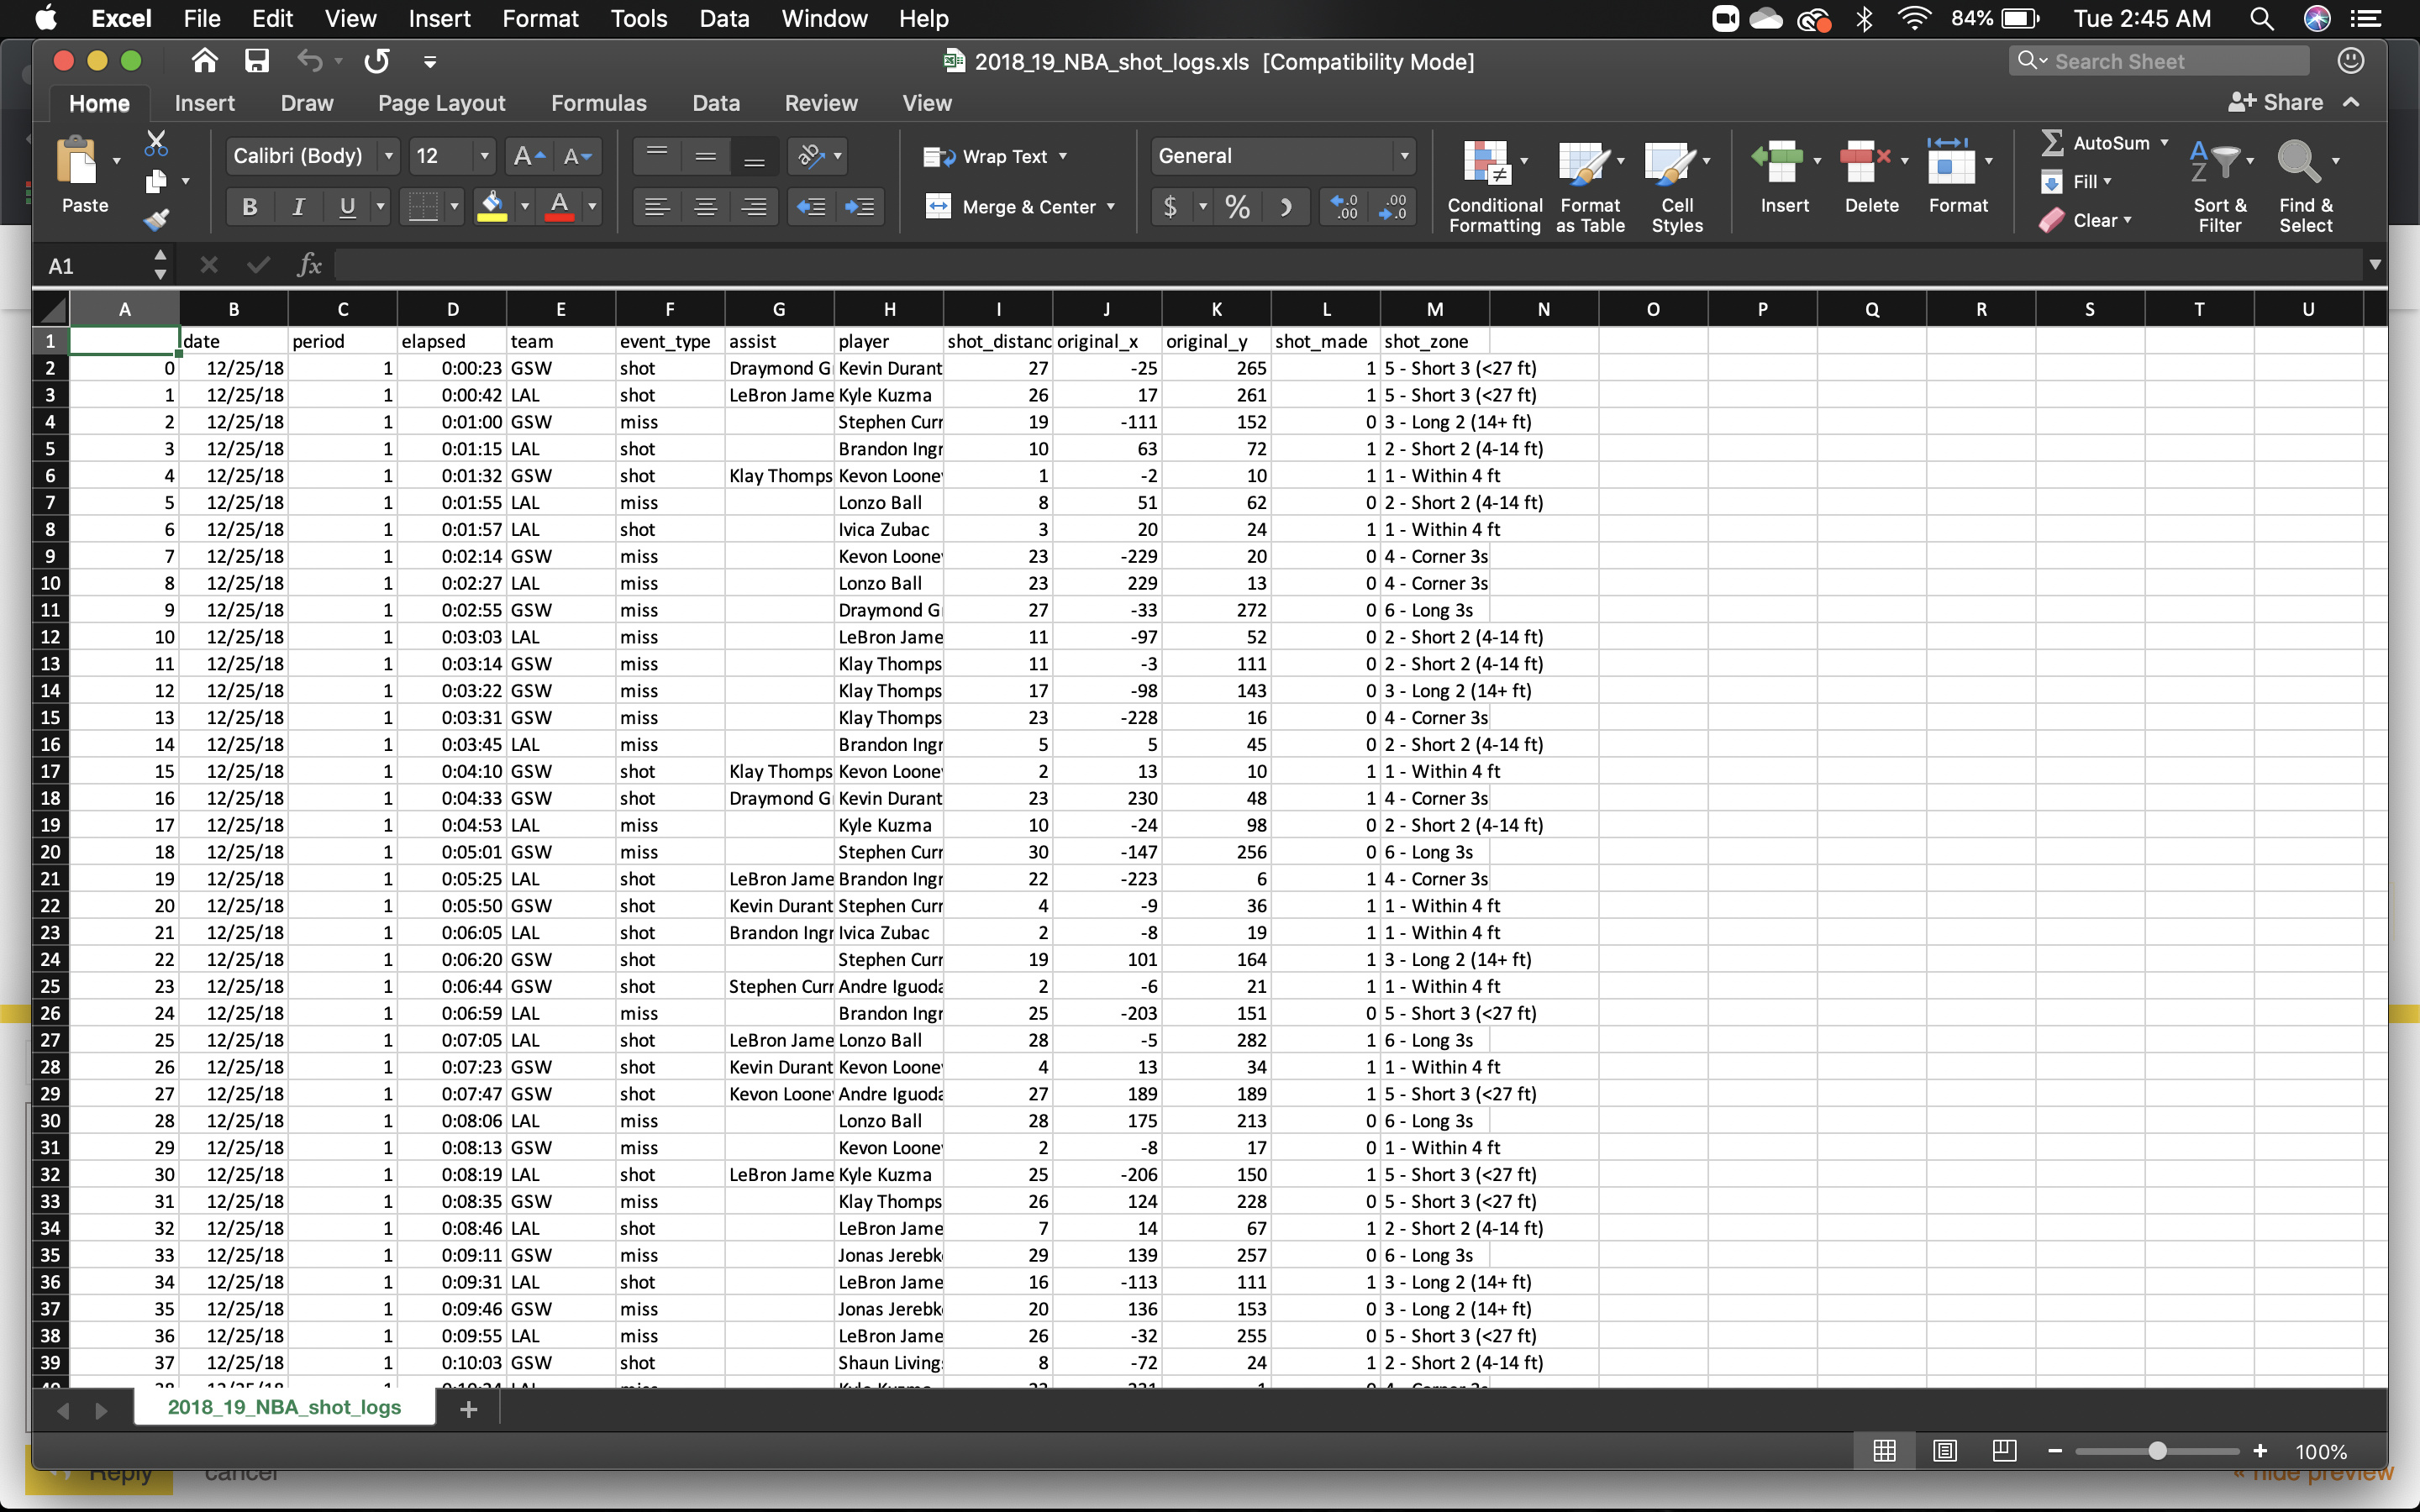
So if you look at the data set, you can see the team, the player who shot the ball, the shot_zone, if the shot was made, and if the shot was assisted by a player.
First, I want to organize by data so each player has a count of the total shots, they made, and of those shots, a count of the assist and by which specific player. So that I can create the following for individual players.

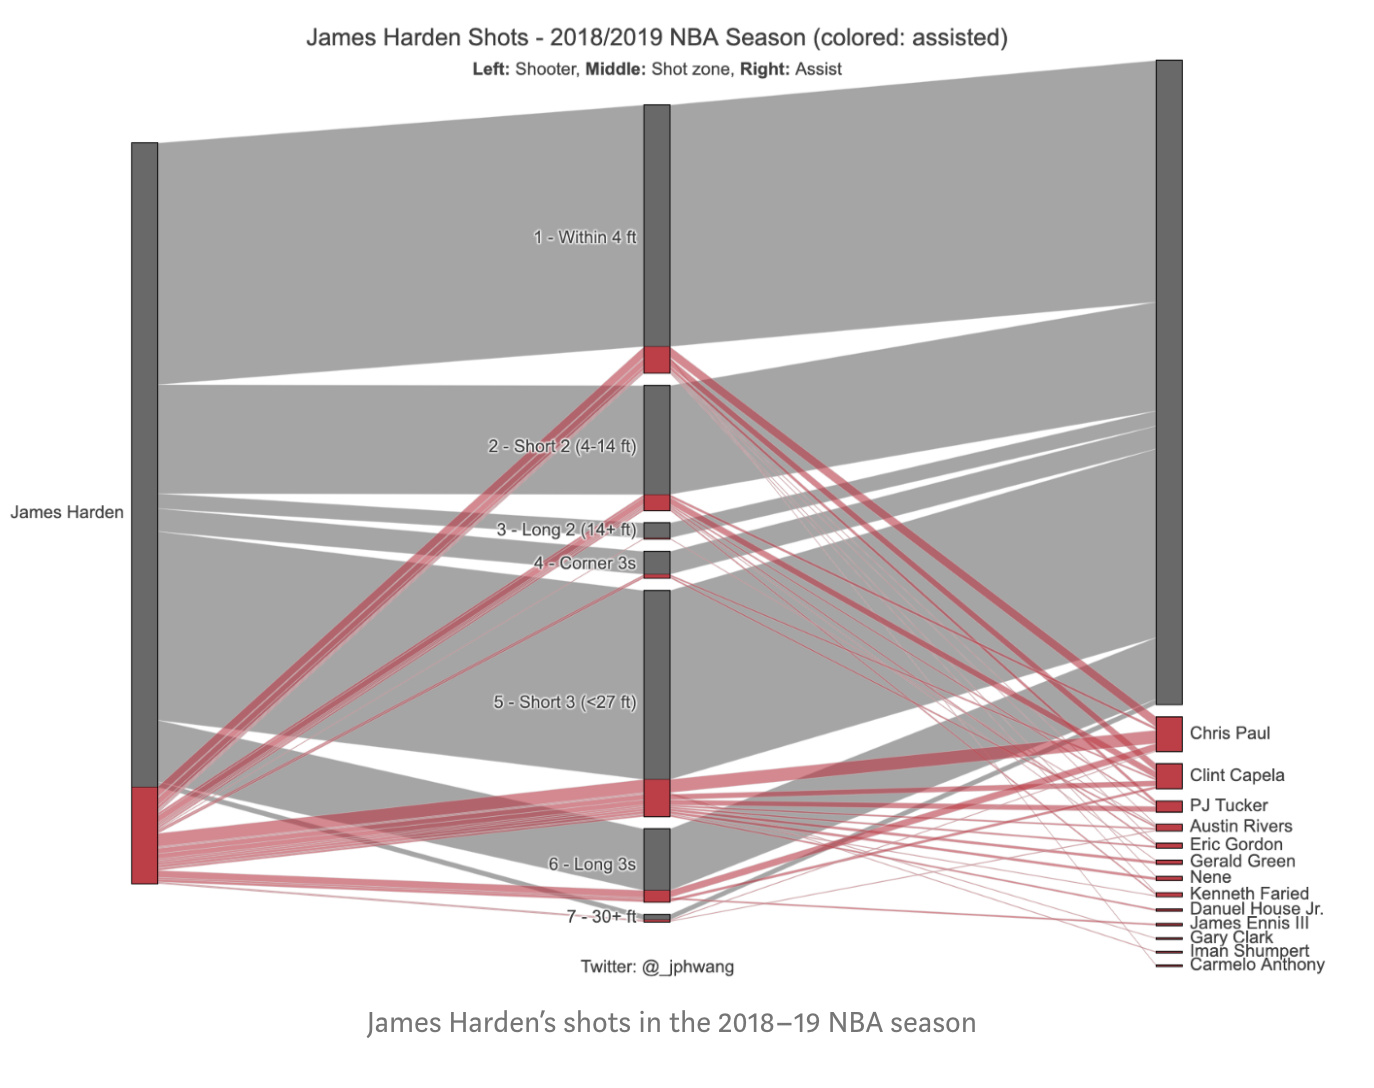
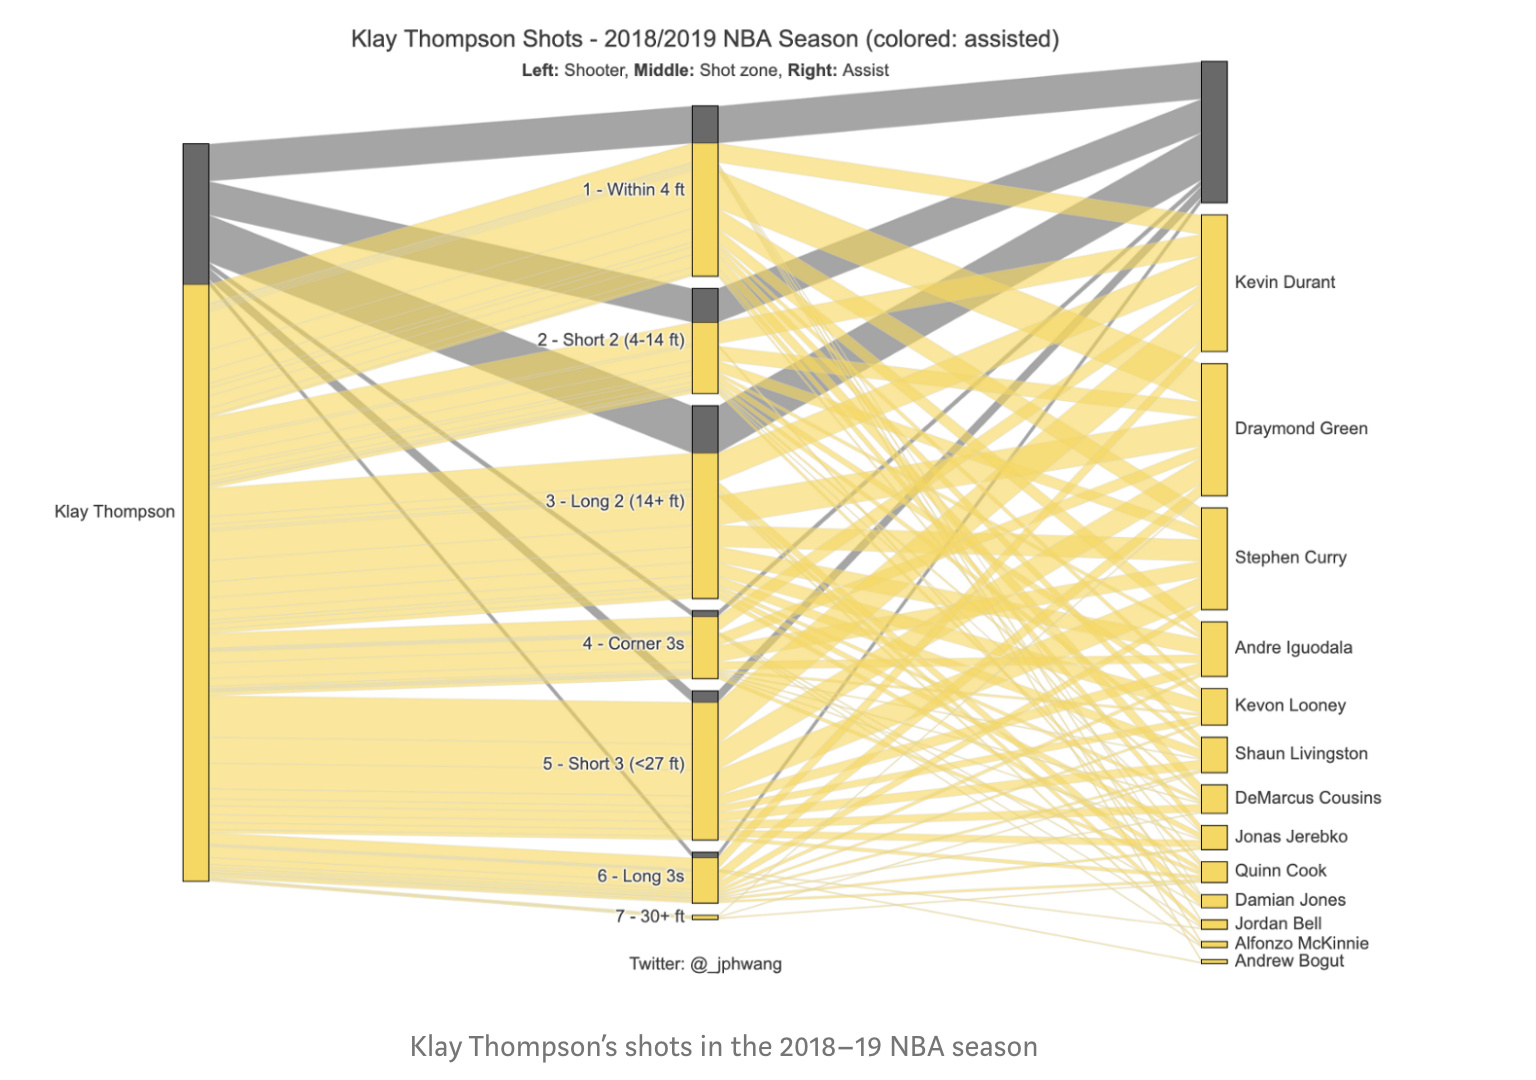
So on the right, you can first see the individual player name, in the middle the shot zone for the shots they actually made, and on the right, if the shots were assisted by a player then the player name and the color is yellow if the shots were assisted.
For example, Clint Capela, the big red stripe at the top connected to James Harden shows he made a bunch of shots from assists from Harden, while the dark grey connected to a strip with no names shows shots he took on his own.
So I need help structuring by data and how I can create the graph. For previous data, someone did suggest the String Manipulation node with the regex replace option but I don’t know how to create a string to manipulate the data like that.
Does that make more sense?
Closing this thread since you have a separate thread addressing the issue above - trying to keep the forum tidy
1 Like