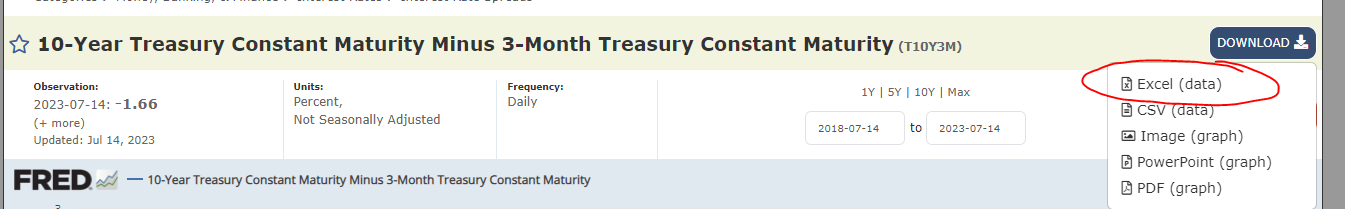
I have asked this question previously but I could not make the suggested options work for me. I am looking for an intermediate Excel option, rather direct pulling data through Json feed. May I request a worked-out example for this particular chart? - 10-Year Treasury Constant Maturity Minus 3-Month Treasury Constant Maturity (T10Y3M) | FRED | St. Louis Fed
What do you exactly mean with an intermediate Excel option? The data in Excel can be downloaded from the link you mention which you can subsequently import in KNIME. Or are you thinking about something else?
1 Like
That is not direct streaming data from FRED. How about we connect to the Jason feed through the API?
Hi @tone_n_tune, I’m guessing that you had a “not” missing from your original question, ie. You are not looking for an intermediate Excel option ? That is quite an important difference, and presumably the reason for @ArjenEX 's question. ![]() .
.
Looking at the api documentation that you linked to there shouldn’t be any reason it cannot be achieved with KNIME using the various http request nodes. I’m not a KNIME charting expert though (I know my limitations ![]() ),
),
but which parts are you having problems with? Pulling the data or charting, or both? Are you after pointers on even where to start?
If you are still looking for the JSON via the API route as per your other topic then please specify into what issue you run into in KNIME and then I’m sure someone will be able to help you out ![]()
1 Like
I have been trying to pull this chart but the Jason Path output is not working. This is the URL I am using in Table Creator:
https://api.stlouisfed.org/fred/series?series_id=T10Y3M&api_key=XXXXXX&file_type=json
I suspect this has to do with the api endpoint that you are using. It does not contain all the values but rather just the meta data.
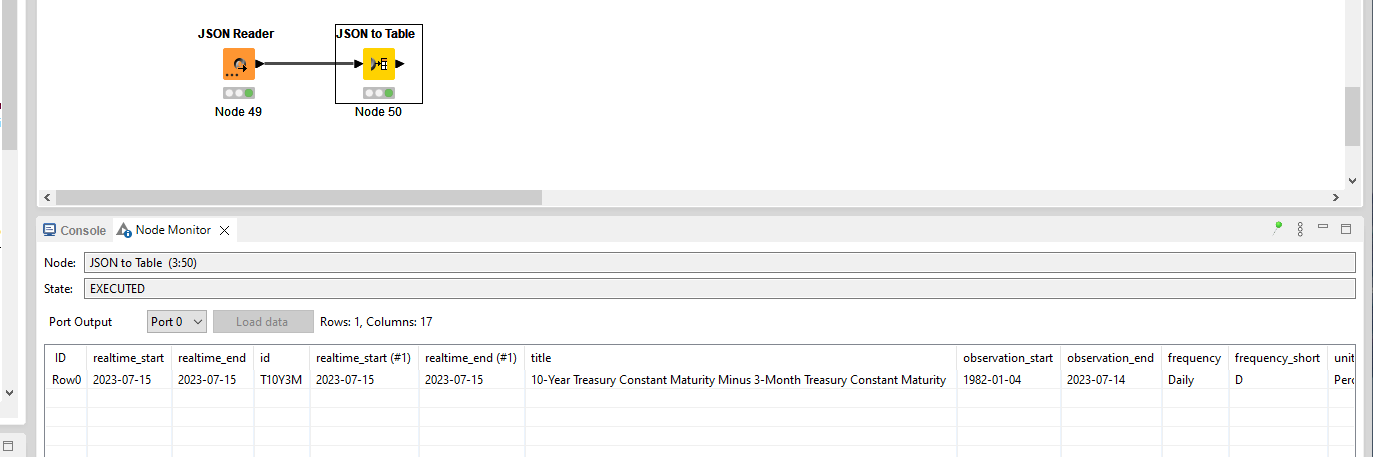
Is there another endpoint related to this?
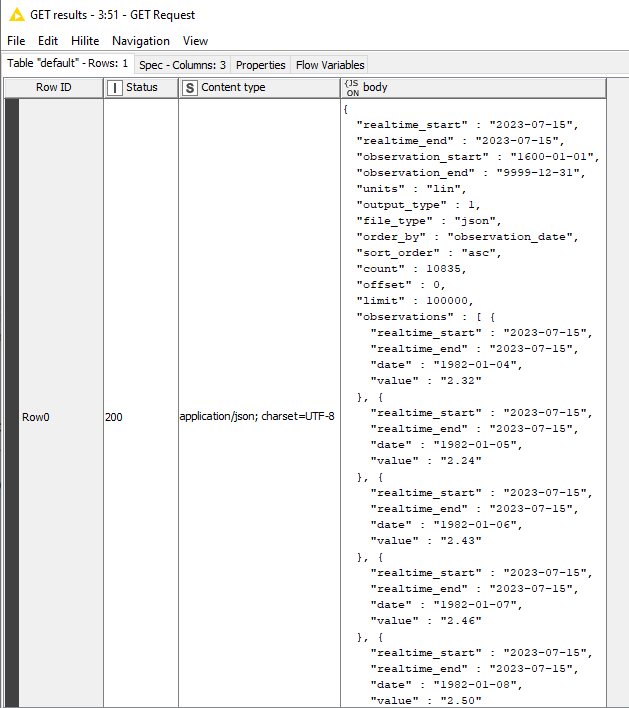
It appears to me that you would need to query https://api.stlouisfed.org/fred/series/observations?series_id=T10Y3M&api_key=xxxxxx&file_type=json instead.
This contains all the data points of T10Y3M.
Then query $['observations'][*]['date'] and $['observations'][*]['value'] in a JSONPath node as collections.
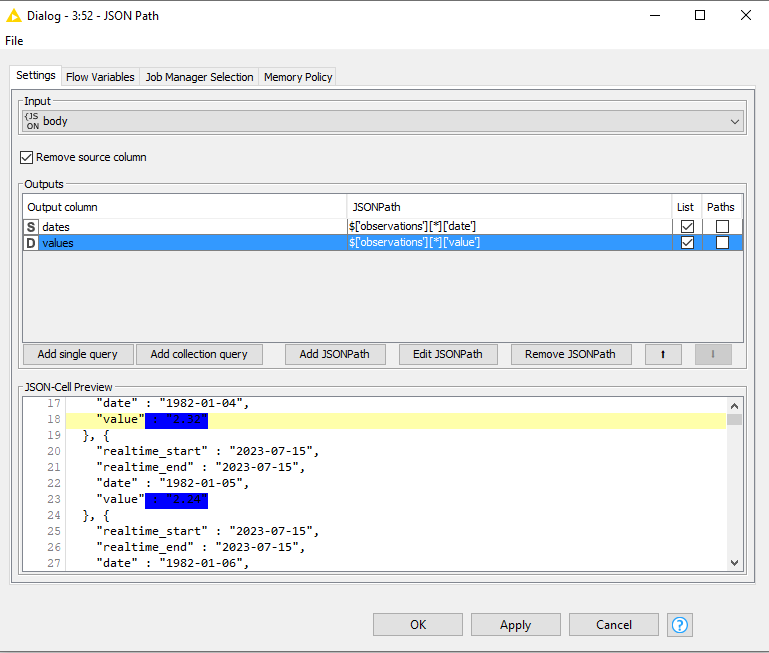
Ungroup them afterafter.
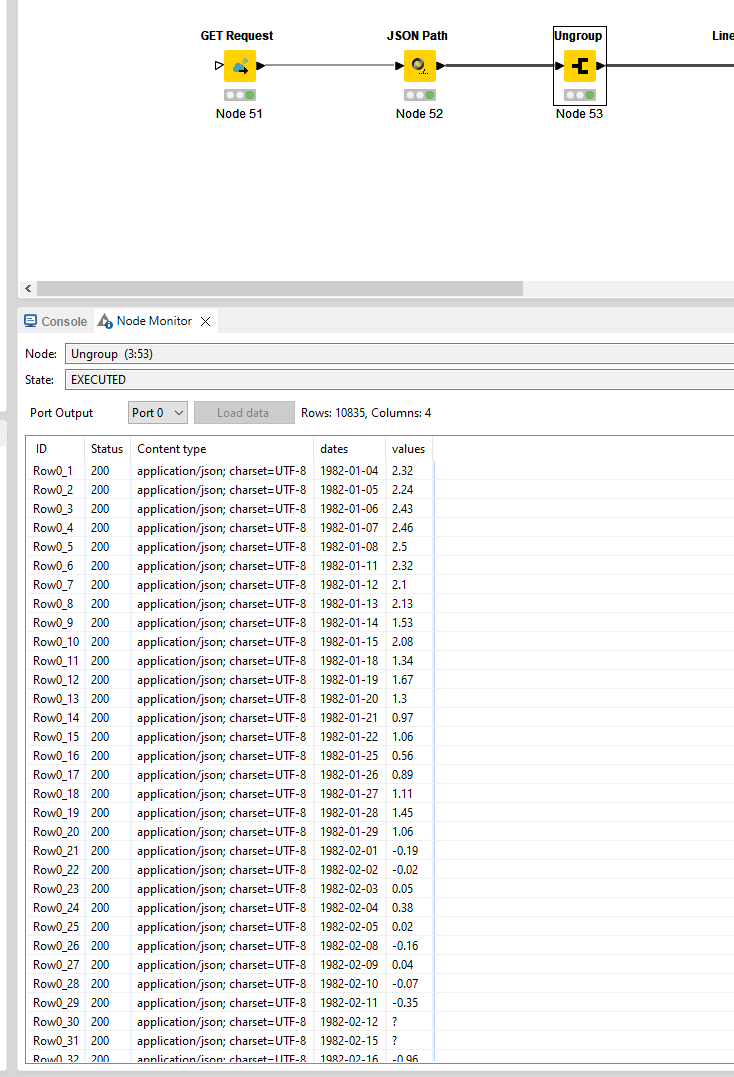
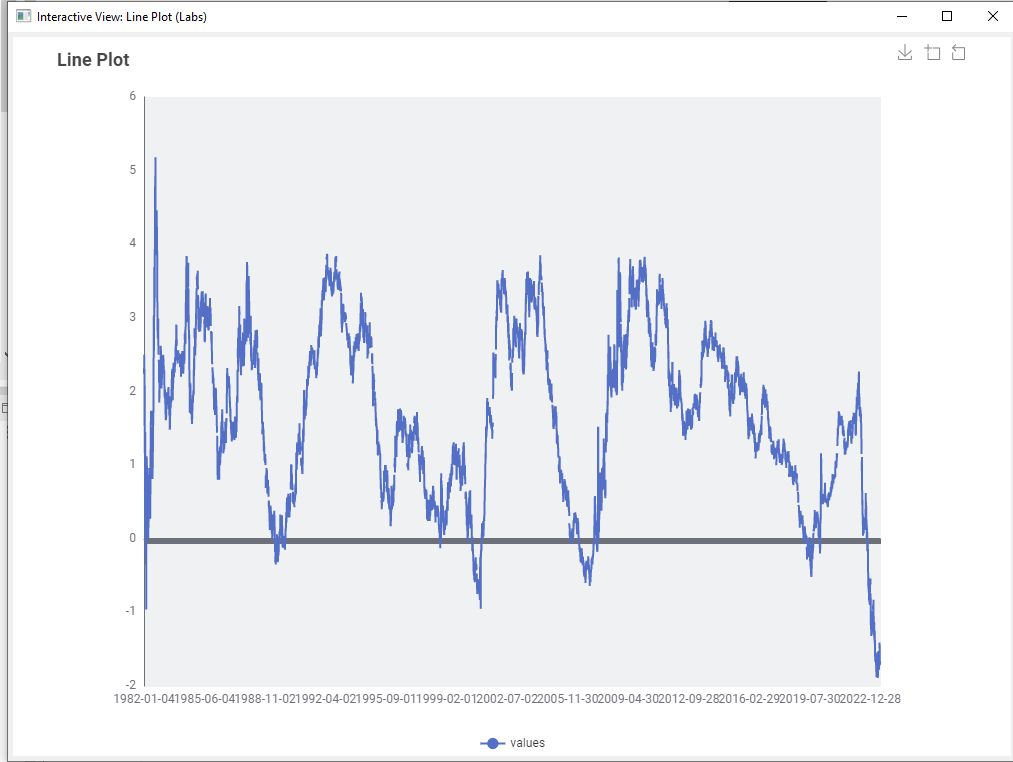
Quick plot of all the data points:
Hope this helps!
5 Likes
Try this. It directly downloads the selected xls file file avoiding JSON parsing.
2 Likes
This helped immensely!
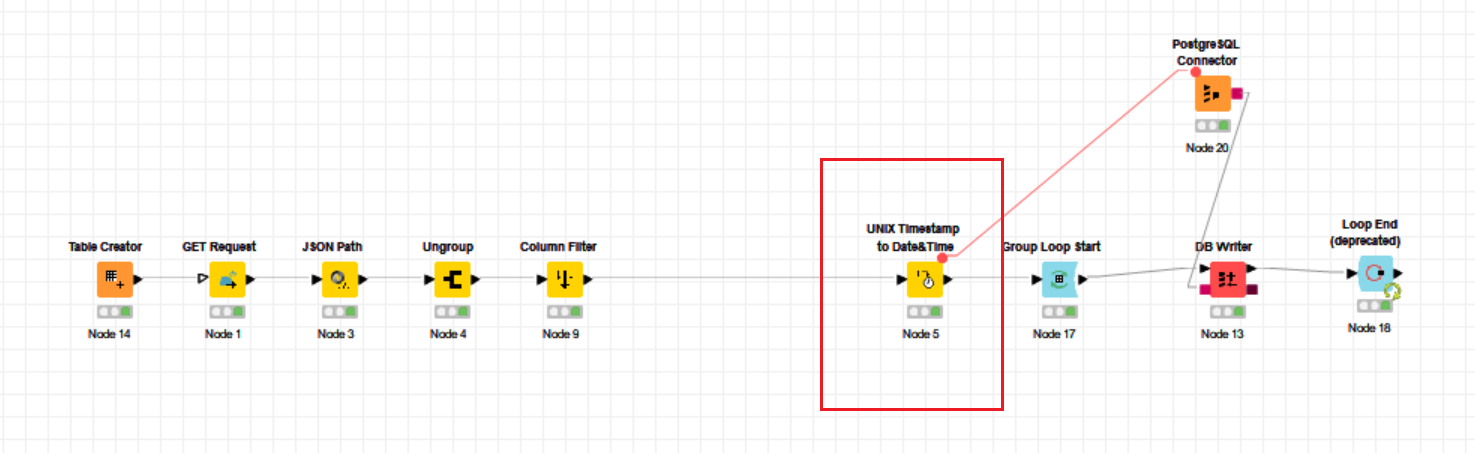
One issue I am facing while repurposing an existing workflow is that I need to remove the Node 5 (Unix timestamp to date&time), but the connection to PostgreSQL Connector can not be anchored anywhere else.
1 Like
Hi @tone_n_tune , what happens if you just attach the flow variable line from the Column Filter to the Postgres connector? I haven’t got KNIME in front of me at the moment to look at the workflow, but at a guess, the flow variable link is only there in this instance for flow sequence control as I don’t think any of the earlier nodes will be creating variables.
If you are unsure how to connect the flow variables from Column Filter, right click on Column Filter and select “Show flow variable ports” (it’s called something like that anyway ![]() )
)
Oh my, this saved my project! Thank you. I was not able to attach the flow variable for so long.
1 Like
Using the workflow I posted here’s the output and a scatter chart (could be changed to line chart.) Took me about a minute to add the FRED symbol to the workflow.

T10Y3M_1.xls (1.0 MB)
1 Like
This topic was automatically closed 90 days after the last reply. New replies are no longer allowed.