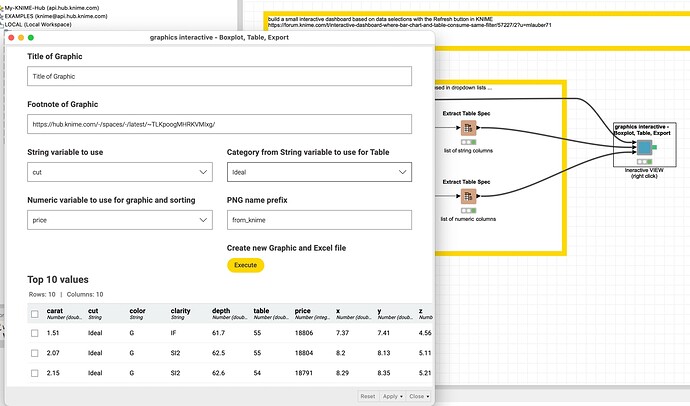
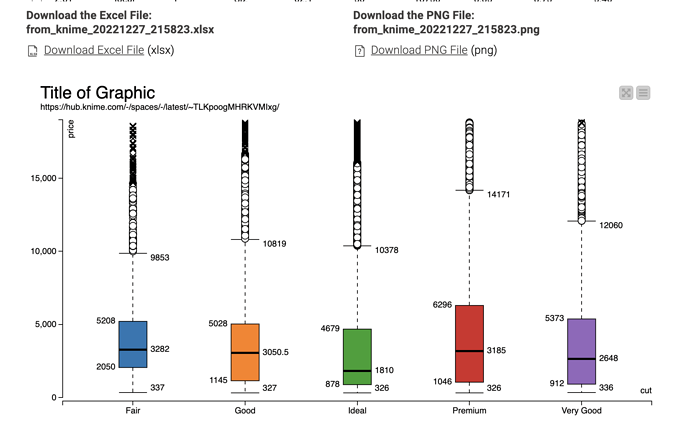
@cdruf_iu here is an example of a dashboard where you could select a string variable and a numeric variable which then will be displayed in a Boxplot.
Also you could select one category from the string variable and sort the rows by the numeric variable descending. Also you can download the graphic as a PNG file with an individual name.
You might be able to adapt that to your needs

